The Top Pages dashboard is part of the Semrush Traffic & Market Toolkit. It reveals which pages on a domain attract the most traffic—helping you understand how content drives performance, what’s trending, and where users are landing first.
Use this dashboard to analyze high-performing content, evaluate competitors’ top entry points, spot new landing pages and promos, and uncover traffic-driving pages across websites.
Getting started with the Top Pages dashboard
The Get Started menu is your entry point into the Semrush Traffic & Market Toolkit. It’s designed to help you quickly enter domains and move into your analysis of their traffic and marketing performance.
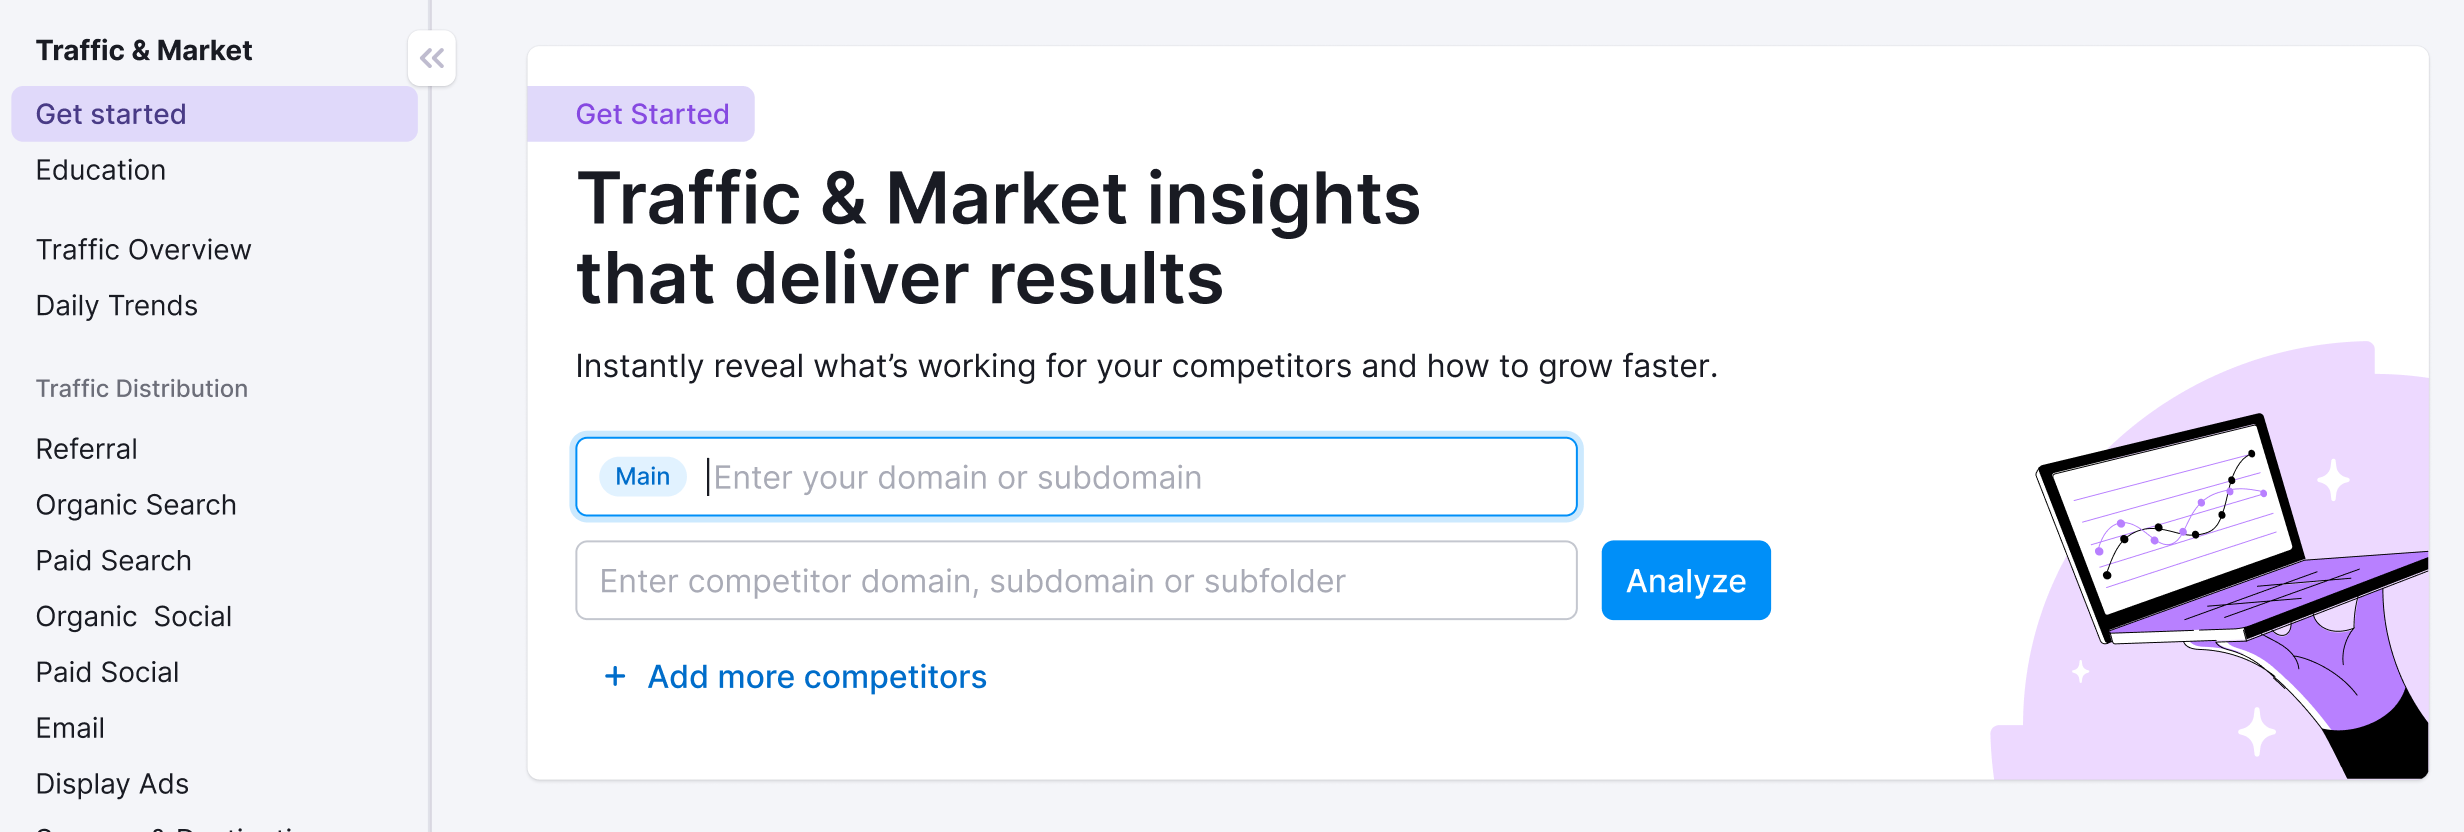
You’ll use this page to kick off your analysis—it’s your launchpad into the entire Traffic & Market experience.
If you haven’t created any projects yet, you’ll see a search panel where you can:
- Type in a domain — Start by entering the main domain you’d like to analyze
- Add additional competitors — Use the “+ Add more competitors” link to compare multiple sites at once
- Click the “Analyze” button — This will pull up dashboards with data and charts, starting with the Traffic Overview dashboard
If you’ve already entered domains into the toolkit, you’ll see them saved as “Folders” and you can access them anytime.
In this case, you’ll see your saved folders listed on the Get Started screen. Click any one of them to jump straight into your dashboards and pick up right where you left off.

Use the “Create Folder” button to start a new project whenever you're analyzing a new domain or market.
Note: At any time inside any dashboard, you can select the Competitor list drop-down in the upper left to edit your current list or create a different one without losing your place.

How to use the Top Pages dashboard
The Top Pages dashboard is interactive and customizable. Use the filters at the top of the page to tailor your analysis and explore traffic flows in detail. Start by selecting your date range, location, and device type preferences.

At the top, you’ll find the Trending Pages section, where you can browse through three tabs—Growing, Declining, and Newly Detected.
Each card highlights a URL, visit count, and the percentage change in traffic, helping you quickly spot pages that are gaining momentum, falling off, or newly emerging in the traffic mix. Click the link to check out the specific page.

Below that, the Top Pages Table presents a comprehensive list of the domain’s highest-performing pages. You can search or scroll to explore, and sort the table using tabs to bring the most relevant metrics to the top.
Columns include:
- Traffic Share
- 1Y Trend
- Visits
- Unique Visitors
- Entrances
- Average Visit Duration
- Exits

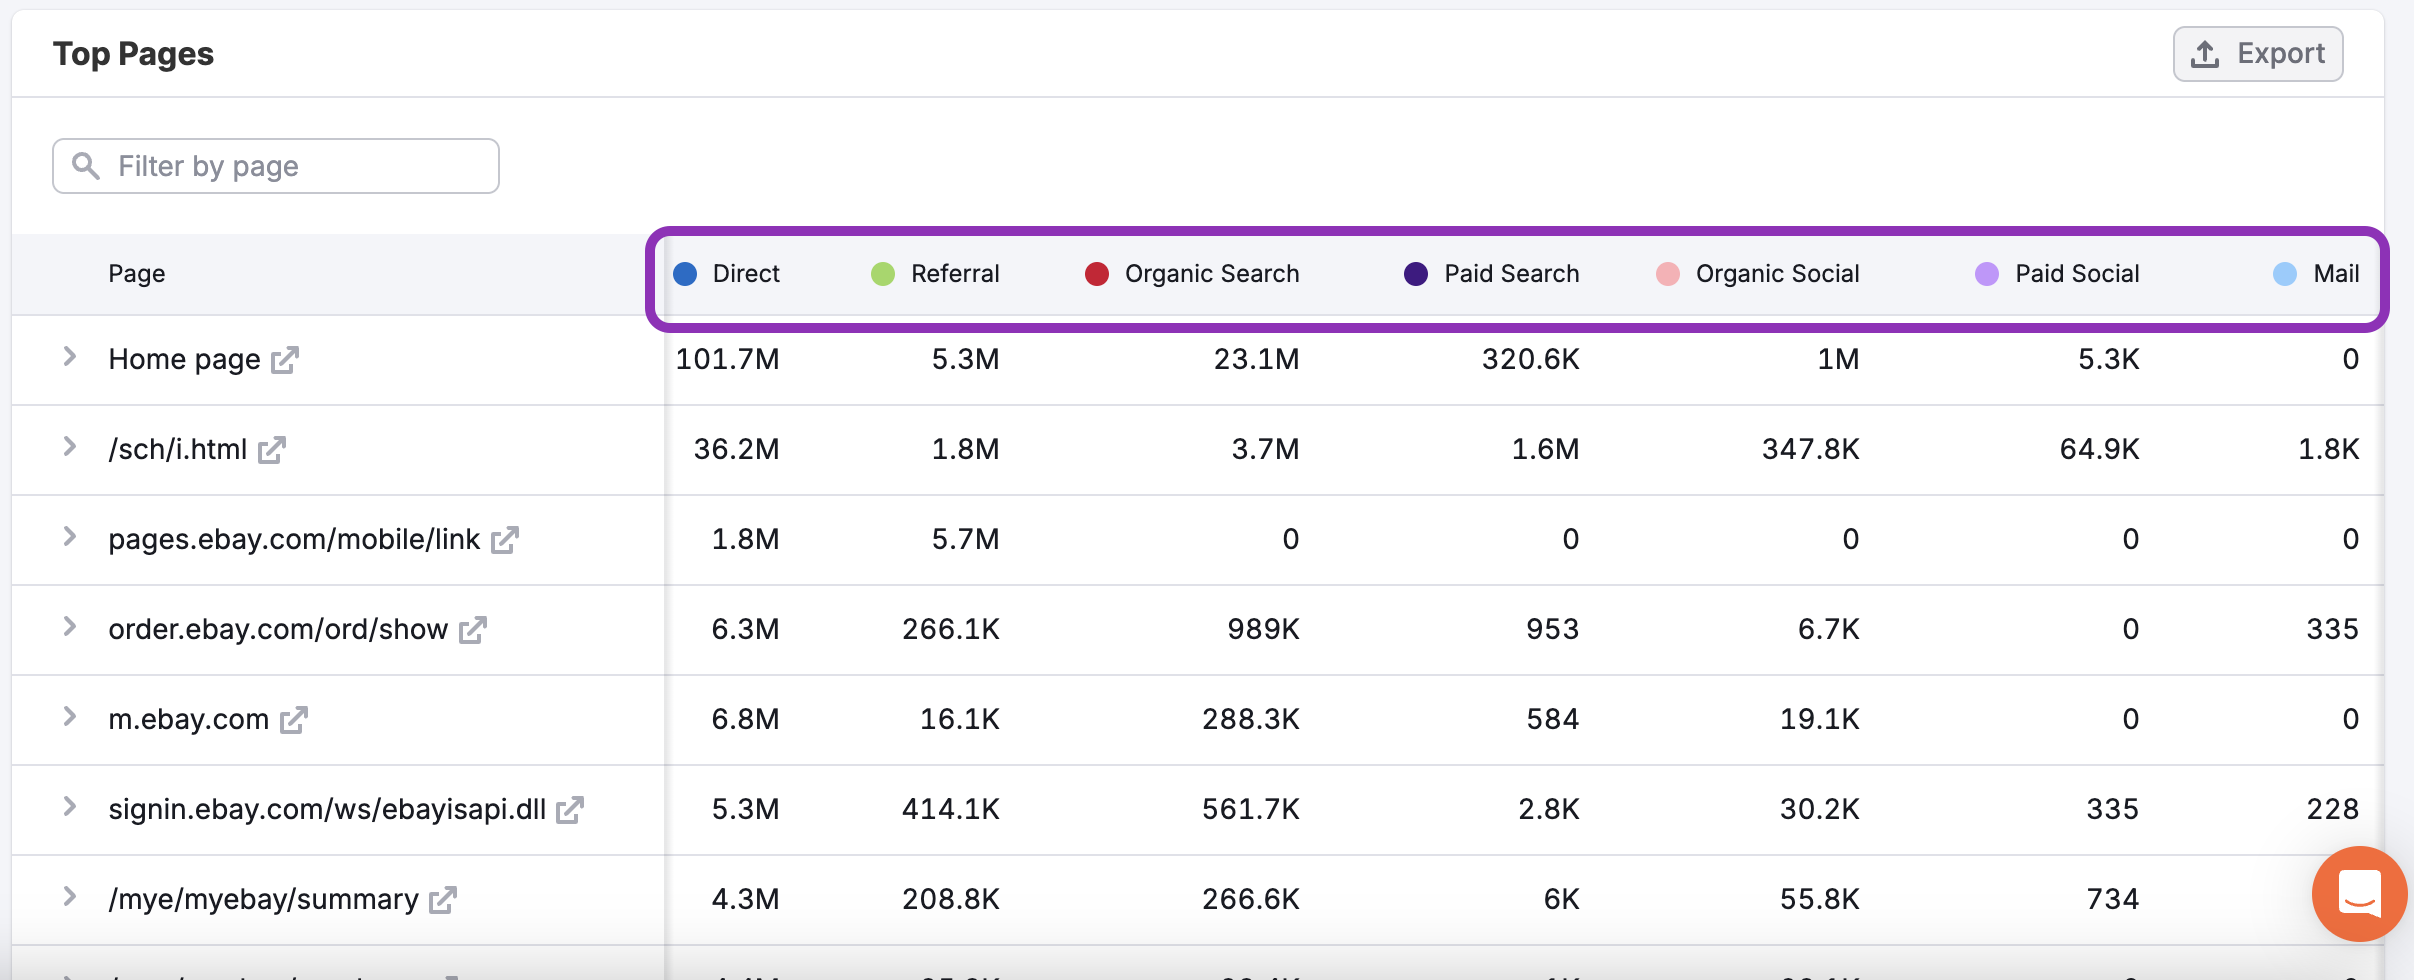
These metrics give you visibility into how each page is performing. By scrolling across the table, you’ll discover a column for each of the key traffic channels, including:
- Direct
- Referral
- Organic Search
- Paid Search
- Organic Social
- Paid Social
- Display Ads
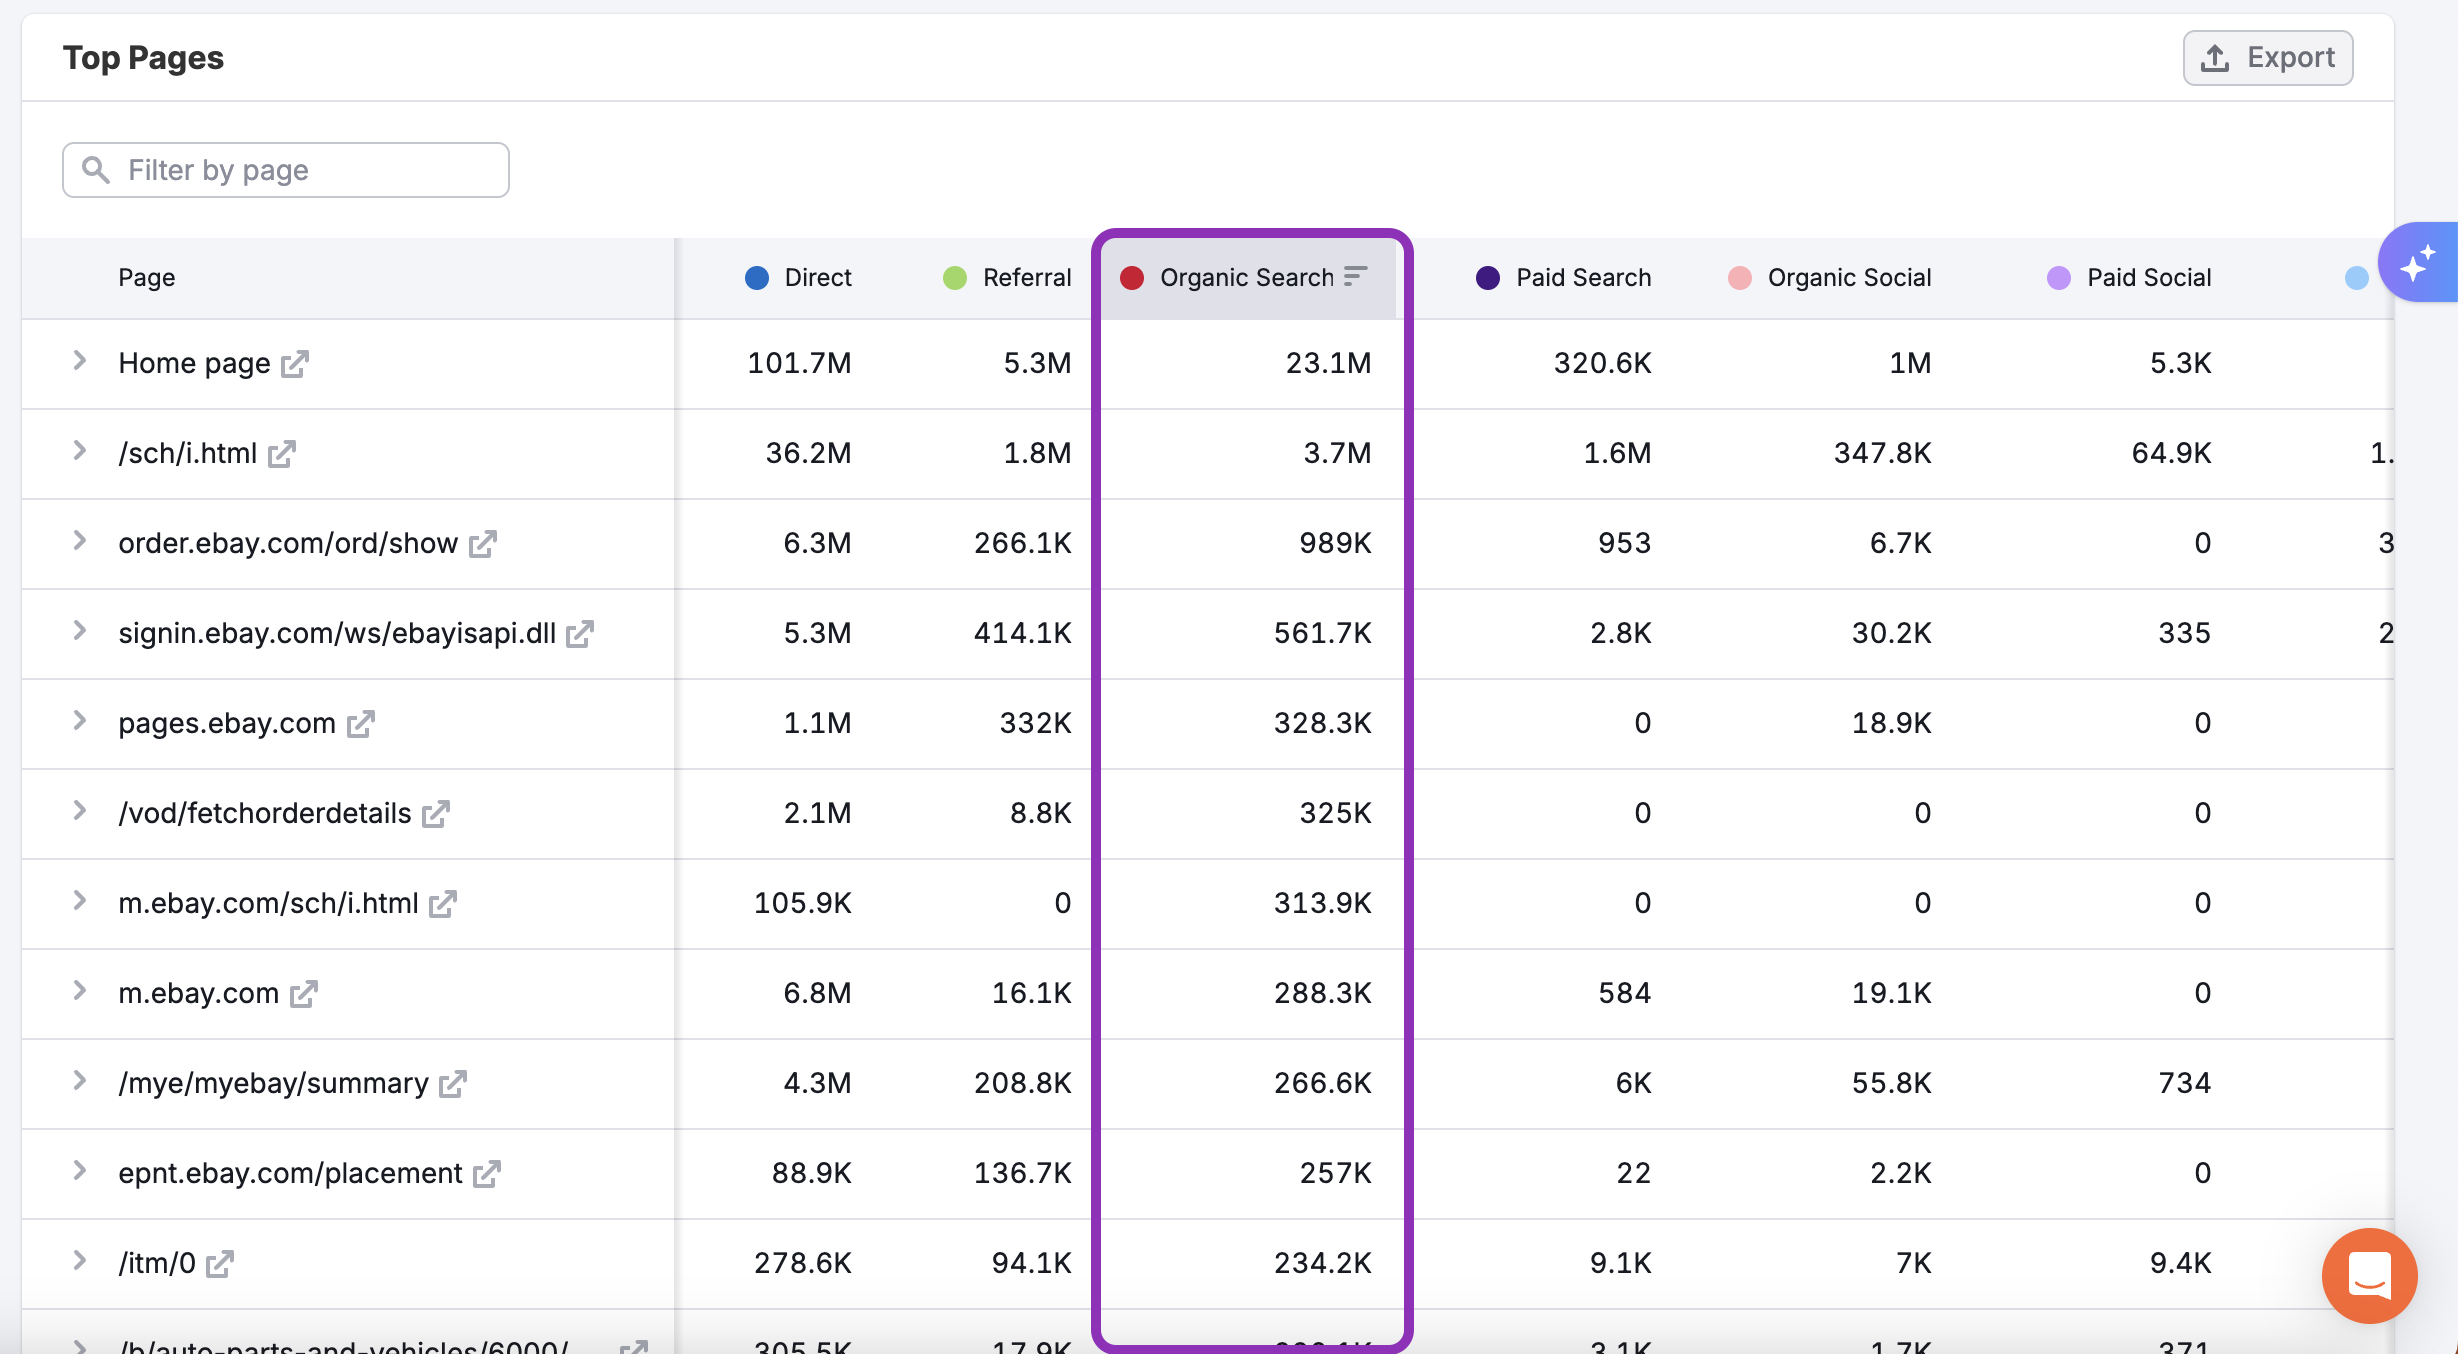
You can click on the tab at the top of the column to sort the pages, bringing the best performing pages in that channel to the top of the list.
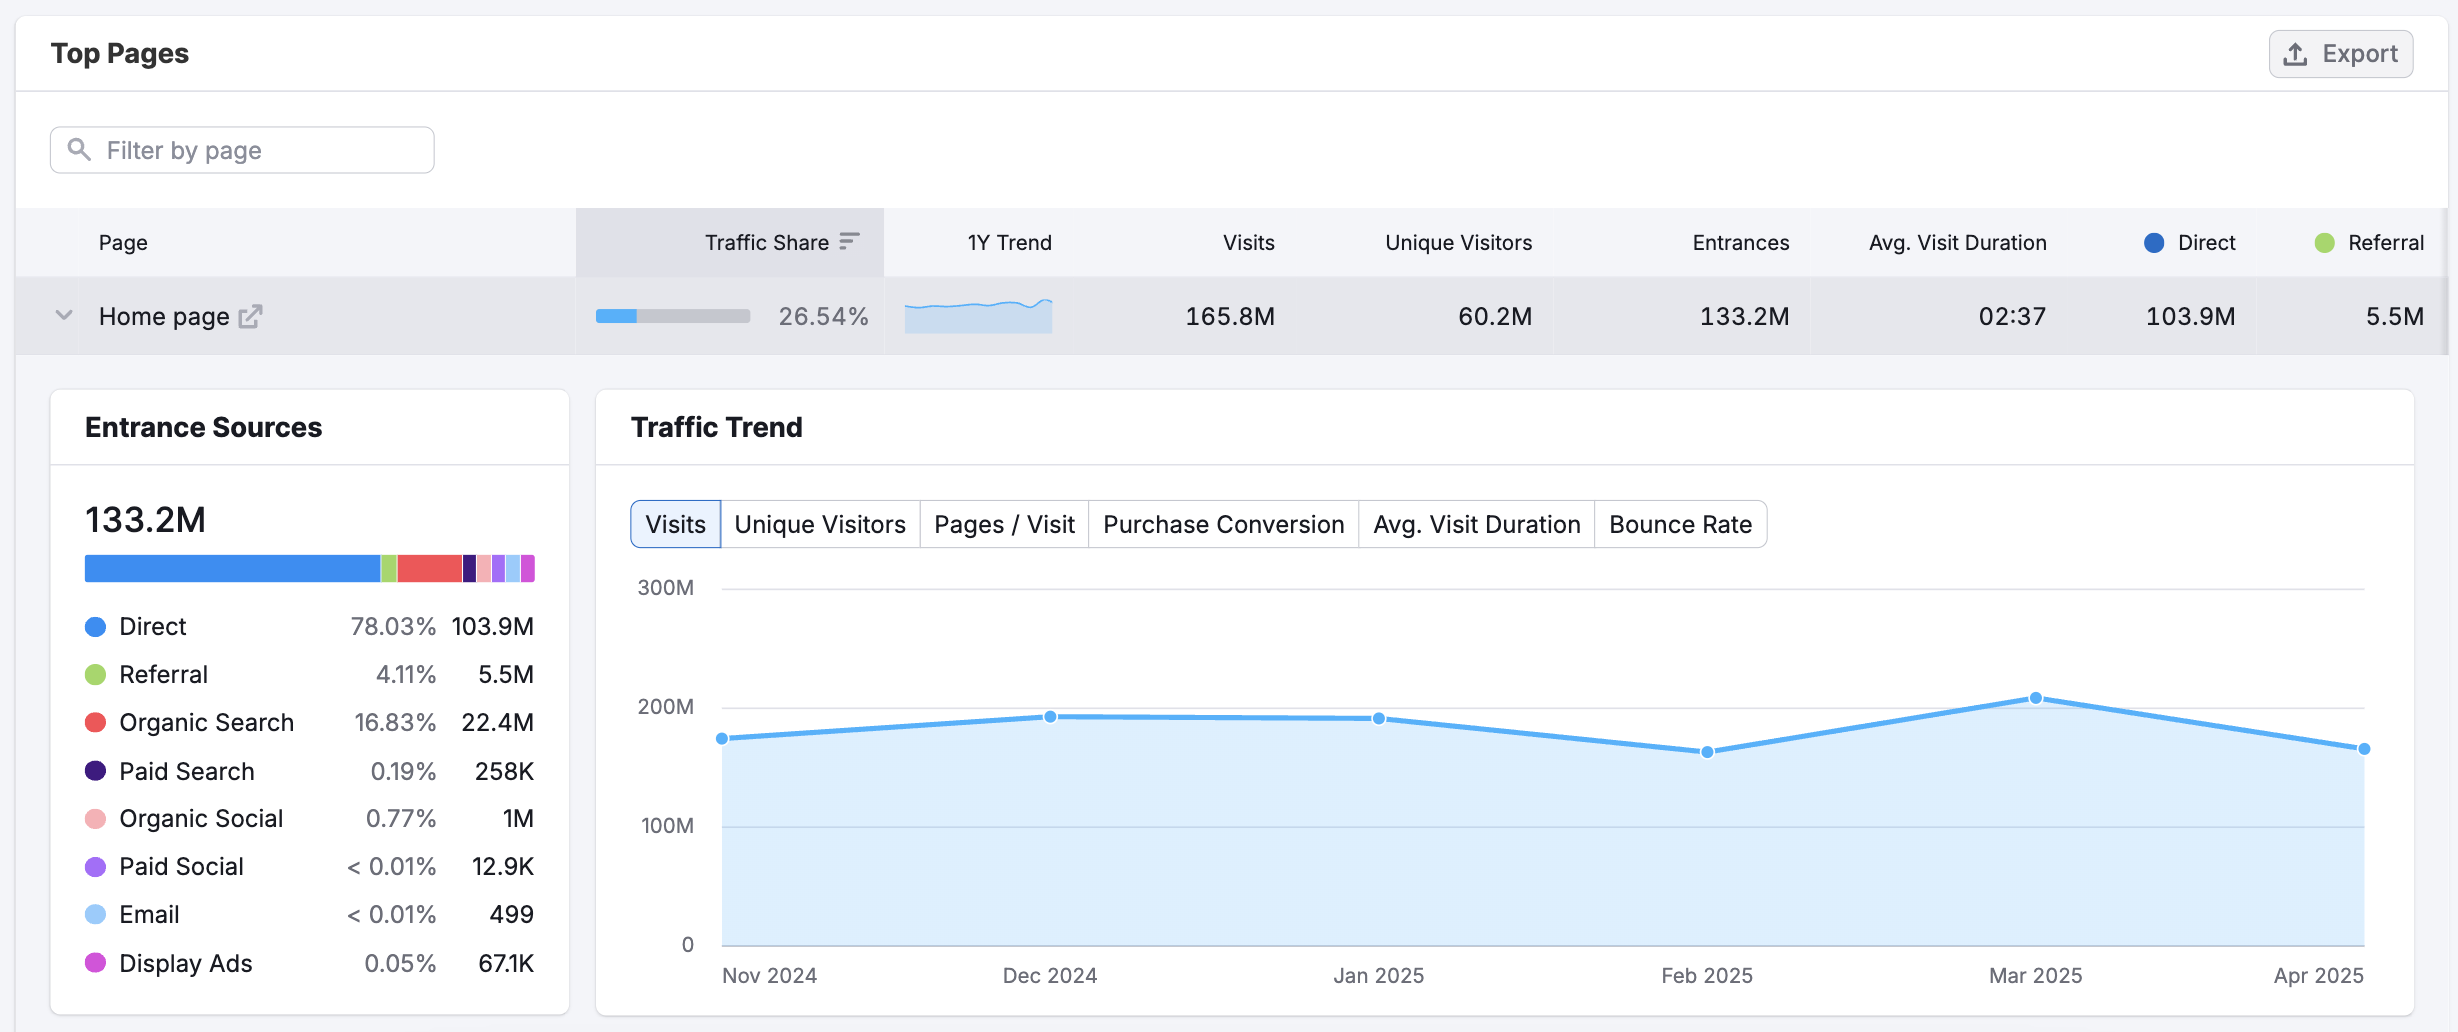
Each page entry in the table includes a dropdown menu that reveals deeper insights. Click on any row to explore detailed traffic source breakdowns, engagement metrics, and acquisition channels specific to that page—giving you a more granular view of how each page is performing and where its traffic is coming from.
Use this dashboard to uncover which competitor pages are driving traffic and which pages have the highest purchase conversion rates—and turn those insights into smarter content and promotion strategies.
How can I act on the insights found in the Top Pages dashboard?
The Top Pages dashboard reveals which competitor pages attract the most traffic—giving you a window into what content resonates with their audience, how their site is structured, and where their momentum is shifting. These insights can directly inform your own content, promotion, and SEO strategies.
Here’s how you can use the data to take meaningful action:
Benchmark against top content: Identify the competitor pages with the most traffic and use them as benchmarks to inspire your own content formats, messaging, or structure.
Spot weak points in competitors’ strategy: See which pages are declining in traffic or underperforming relative to others—opening potential gaps you can take advantage of.
Monitor content trends: Use the Growing, Declining, and Newly Detected tabs to spot what types of content or product pages are gaining traction across competitors.
Prioritize your efforts: Focus your SEO, content, or partnership strategy on the areas where competitor pages are succeeding—whether that’s specific formats, topics, or page types.
By keeping a close eye on the Top Pages dashboard, you can stay ahead of the competition—learning from what works, avoiding what doesn’t, and continuously refining your strategy based on real-world performance signals.
What other Traffic & Market dashboards should I explore?
Pair Top Pages with these related dashboards for deeper insights:
- Traffic Overview – A summary of overall traffic and performance
- Daily Trends – To monitor short-term shifts in performance
- Subfolders & Subdomains – To understand content hierarchy
- Sources & Destinations – For full user journey mapping
View the full Traffic & Market Toolkit to access these and other dashboards.