The Daily Trends dashboard in the Traffic & Market Toolkit gives you a real-time view of traffic and engagement performance—day by day, channel by channel.
It’s designed for spotting time-critical shifts in competitor strategy, campaign impact, or market activity. Whether you’re monitoring a major launch or just looking for subtle signs of change, this dashboard delivers high-frequency insights you can act on fast.
Getting started with the Daily Trends dashboard
The Get Started menu is your entry point into the Semrush Traffic & Market Toolkit. It’s designed to help you quickly enter domains and move into your analysis of their traffic and marketing performance.
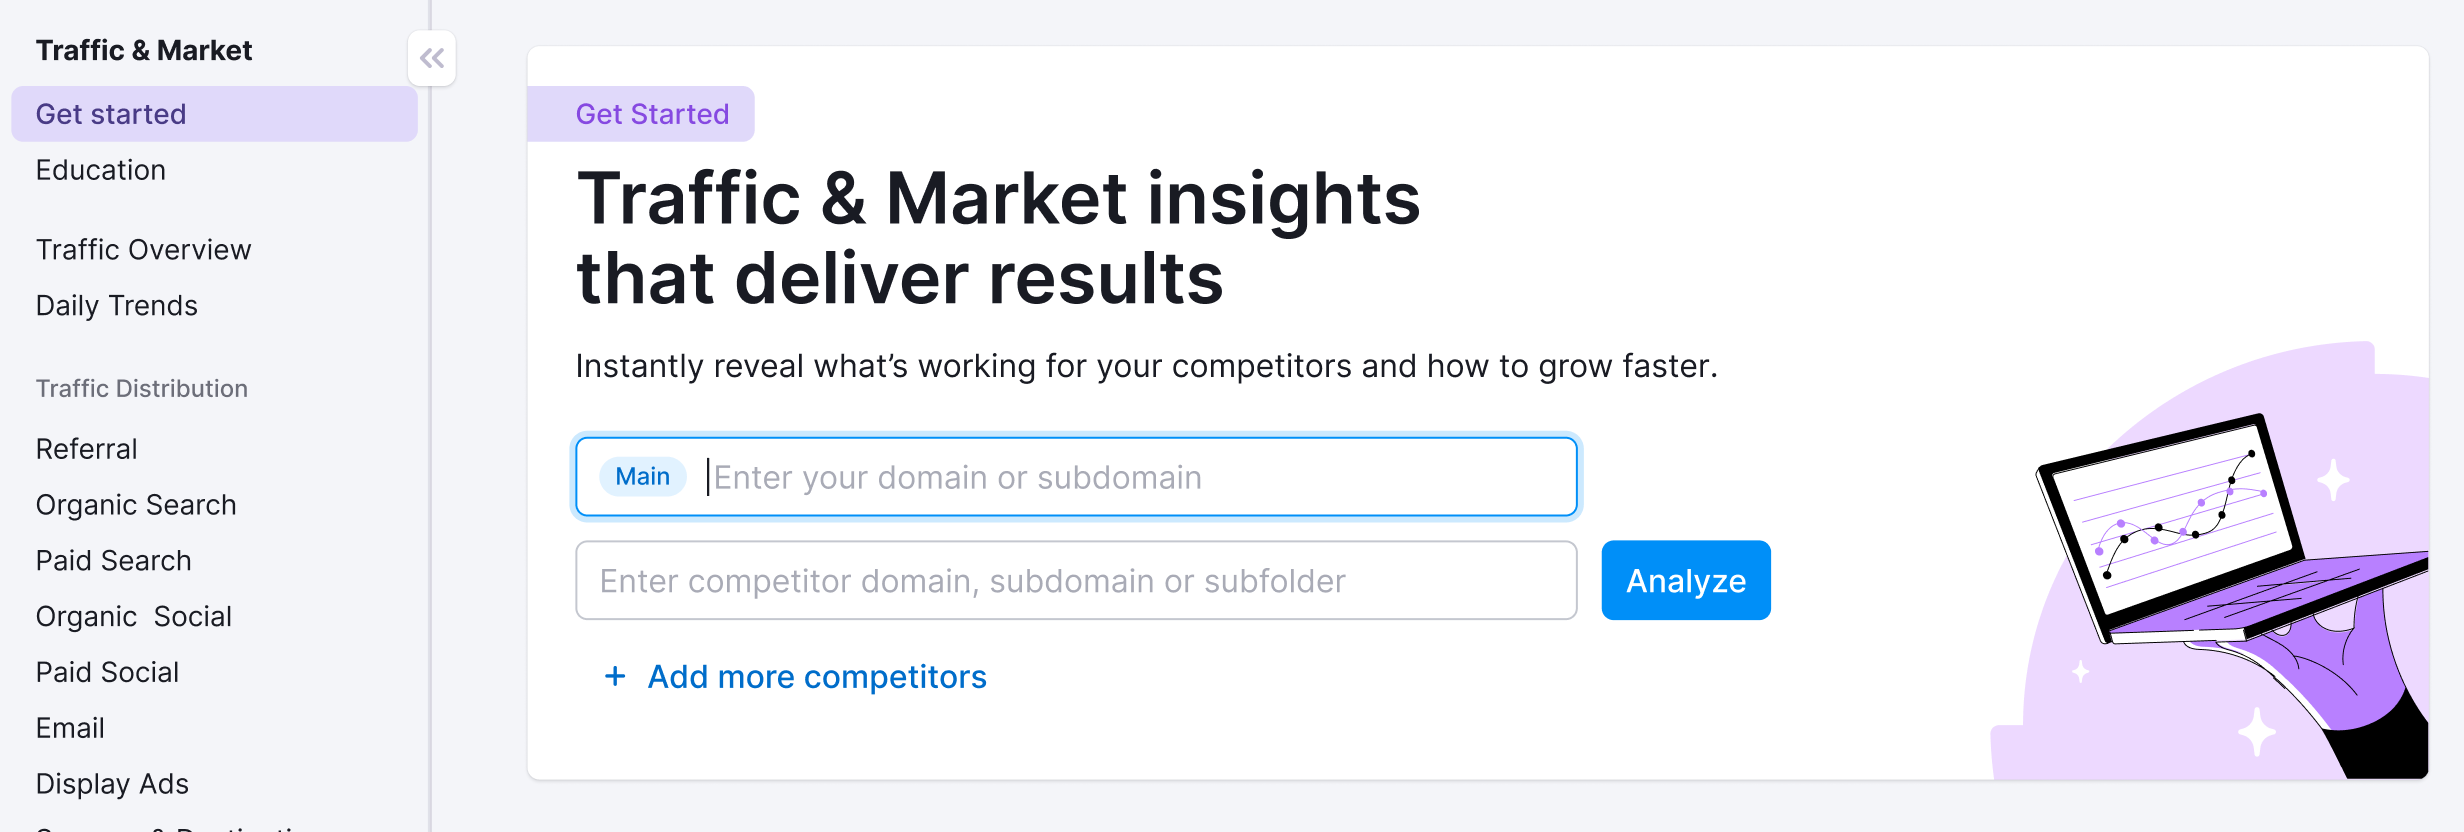
You’ll use this page to kick off your analysis—it’s your launchpad into the entire Traffic & Market experience.
If you haven’t created any projects yet, you’ll see a search panel where you can:
- Type in a domain — Start by entering the main domain you’d like to analyze
- Add additional competitors — Use the “+ Add more competitors” link to compare multiple sites at once
- Click the “Analyze” button — This will pull up dashboards with data and charts, starting with the Traffic Overview dashboard
If you’ve already entered domains into the toolkit, you’ll see them saved as “Folders” and you can access them anytime.
In this case, you’ll see your saved folders listed on the Get Started screen. Click any one of them to jump straight into your dashboards and pick up right where you left off.
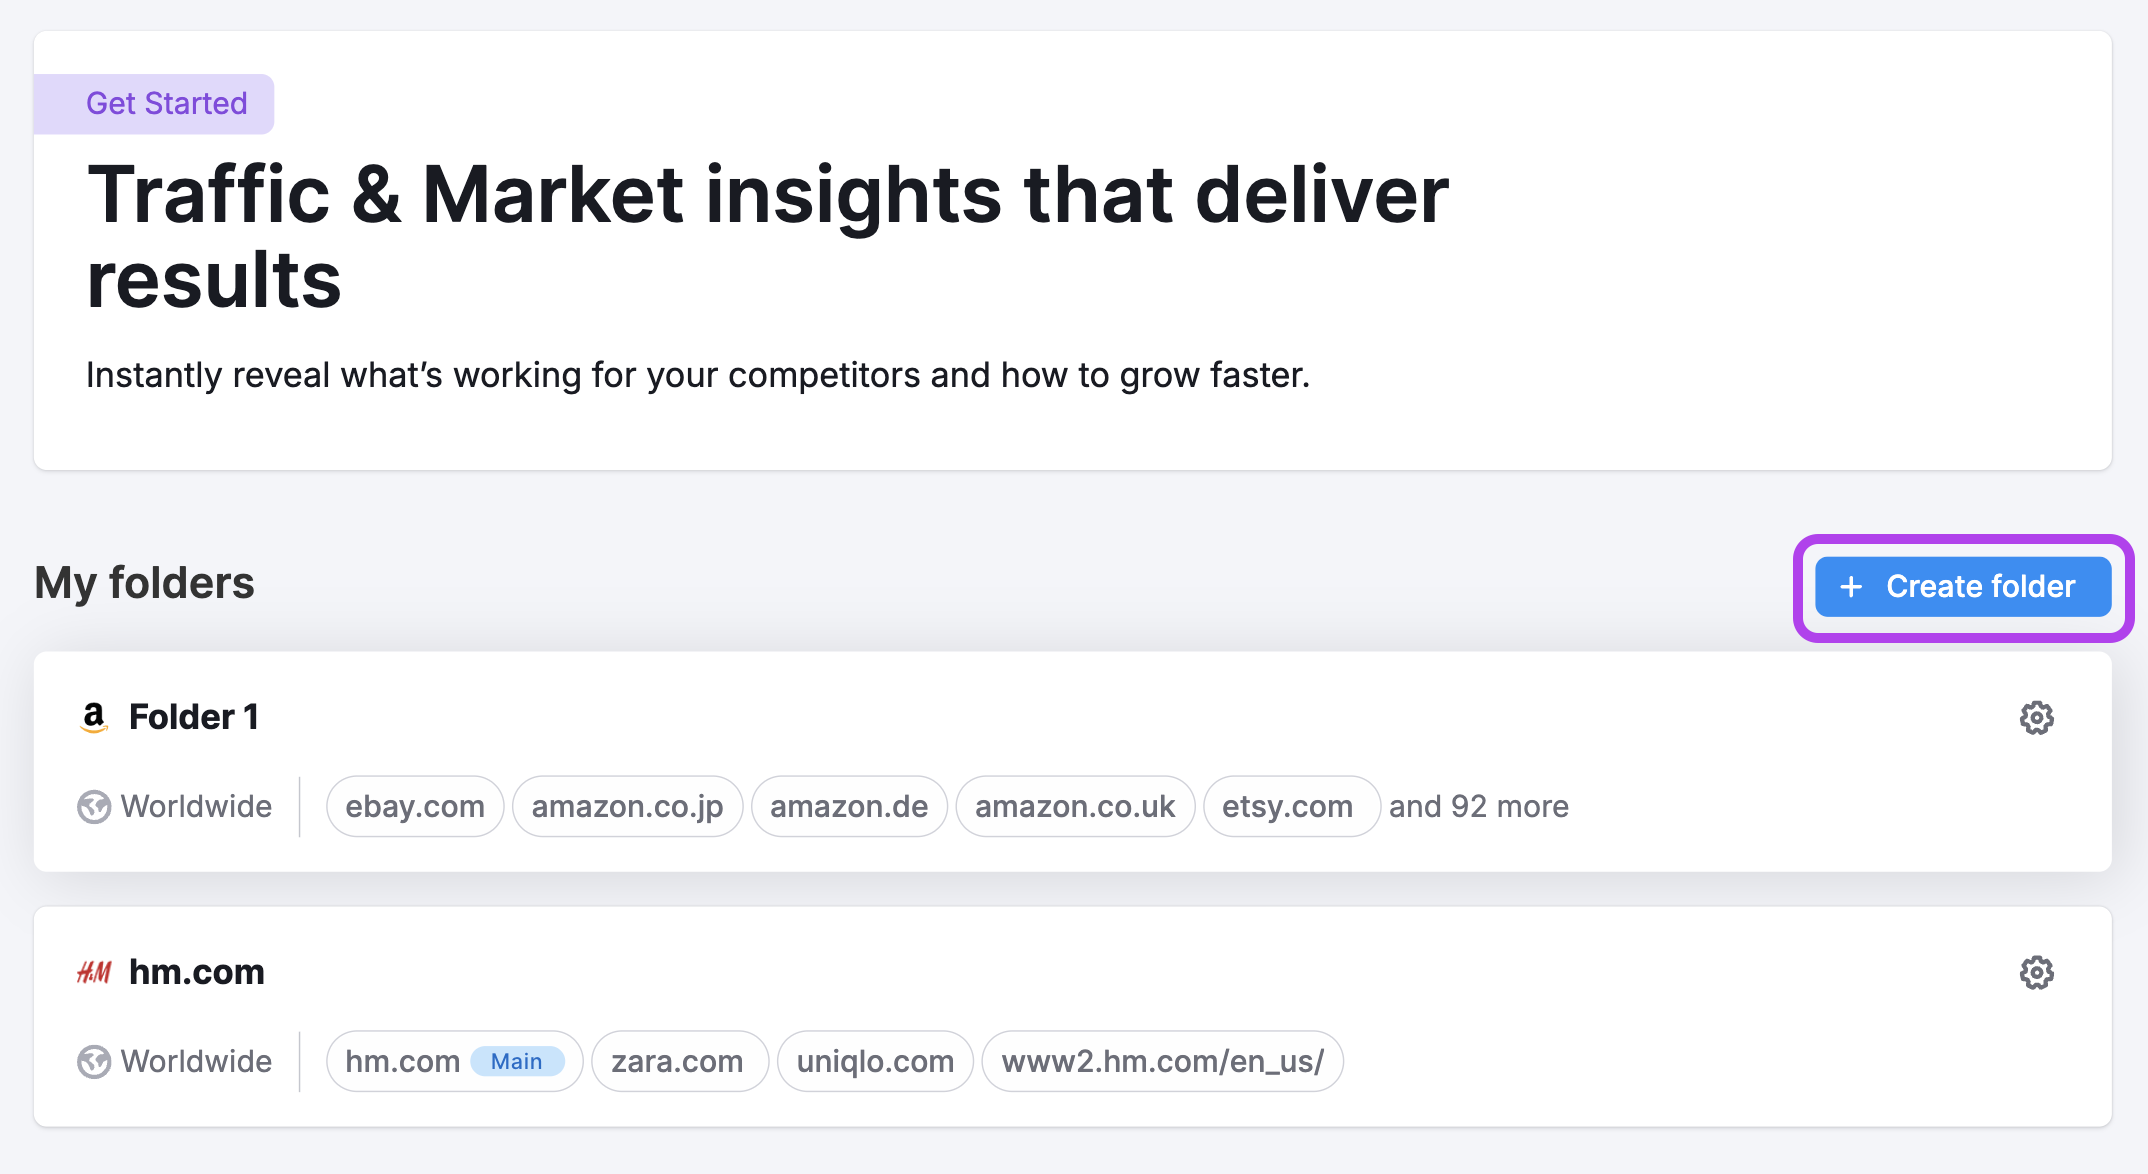
Use the “Create Folder” button to start a new project whenever you're analyzing a new domain or market.
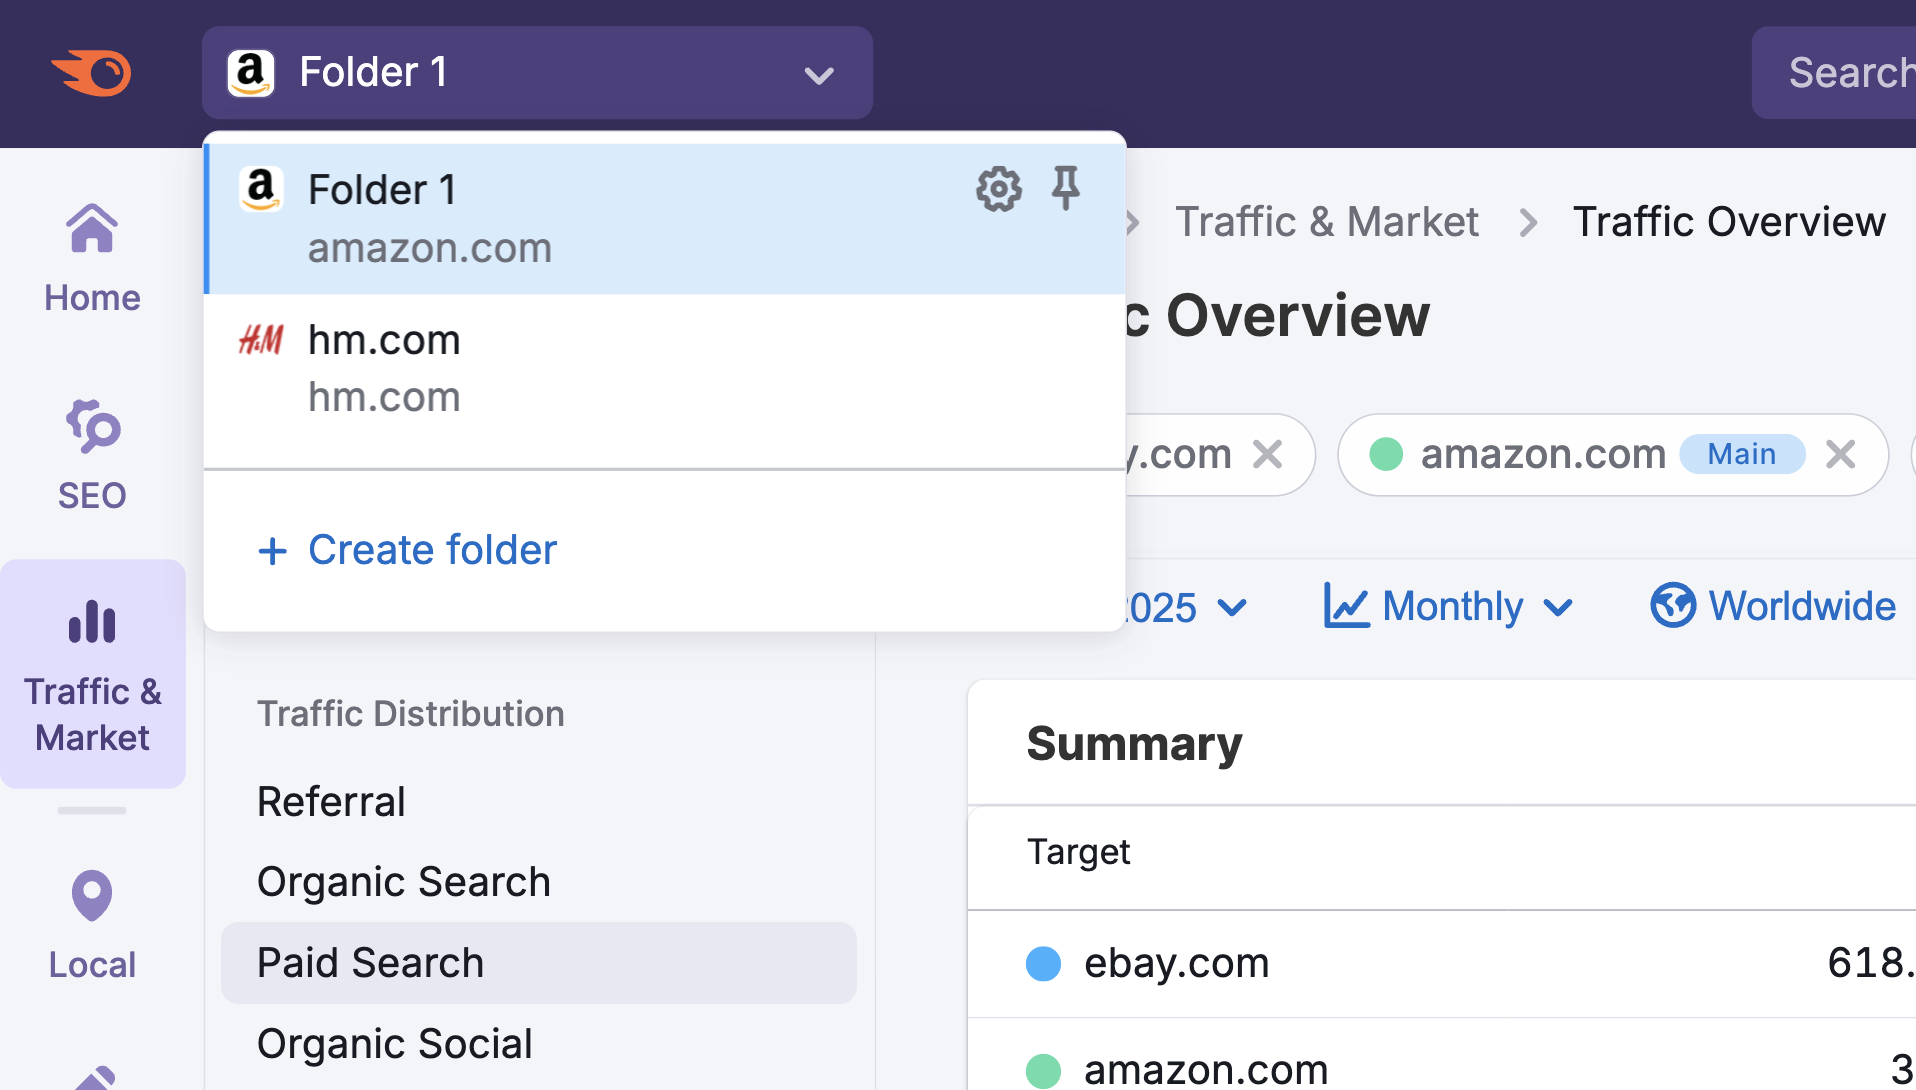
Note: At any time inside any dashboard, you can select the Competitor list drop-down in the upper left to edit your current list or create a different one without losing your place.
Daily Trends dashboard key features
The Daily Trends dashboard is divided into three key sections, each offering a unique layer of insight into daily traffic behavior:
Note: At any time, you can adjust the date range, switch between daily, weekly, or monthly data, select a device type, and filter by location using the controls at the top of the dashboard.

Traffic Trend Graph
This top section shows overall daily performance for the selected domain. You can toggle between metrics like:
- Visits
- Unique Visitors
- Pages per Visit
- Average Visit Duration
- Bounce Rate

Use this chart to track engagement and traffic volume day by day. It's especially useful for spotting sudden spikes, drops, or patterns in user behavior over time.
Traffic Channel Trends
This line graph shows how traffic from each channel changes over time. Channels include:
- Direct
- Referral
- Organic Search
- Paid Search
- Organic Social
- Paid Social
- Display Ads

Use this view to compare how each traffic source performs on a daily basis. It's helpful for identifying shifts in a competitor’s marketing mix or spotting which channels are trending up or down.
Daily Traffic by Channel
The lower section breaks out each traffic channel into its own mini graph. You’ll see daily traffic trends for:
- Direct – Traffic from users typing in the URL or using bookmarks
- Referral – Traffic from links on external websites
- Organic Search – Visits from search engines without paid ads
- Paid Search – Traffic from search ads like Google Ads
- Organic Social – Visits from unpaid social media posts
- Paid Social – Visits from social media ads
- Email – Traffic from email campaigns
- Display Ads – Traffic from banner/display advertising

This level of granularity allows you to zoom in on the performance of individual channels—perfect for campaign tracking, identifying the impact of media spend, or understanding which specific strategies are working.
Note: Each graph includes a “View dashboard” button that takes you to a full dashboard dedicated to that specific traffic channel. There, you’ll find more detailed insights—such as top-performing pages, a breakdown of desktop vs. mobile traffic, and, where available, the top keywords driving traffic through that channel.
How can I act on the insights found in these dashboards?
The Daily Trends dashboard is designed to help you respond faster and smarter to changes in competitor behavior and market activity.
Here's how you can turn these insights into action:
- Track campaign impact in real time
If a competitor just launched a new product, promotion, or ad campaign, daily traffic patterns can reveal how effective it is—and which channels are driving the results. - Spot traffic spikes or drops early
Sudden increases in visits may signal a surge in visibility, a viral campaign, or a traffic-driving partnership. Declines might indicate a loss in rankings, reduced spend, or shifting audience attention. - Refine your own channel strategy
If you notice a competitor gaining ground in a specific channel—like Paid Search or Organic Social—you can adjust your own investments to counter or capitalize on the trend. - Identify seasonal trends or weekly patterns
Some businesses see clear patterns in daily traffic (e.g., weekend spikes or midweek lulls). Understanding these rhythms can help with content planning, publishing schedules, and campaign timing. - Monitor post-launch performance
After launching a new product, content piece, or media campaign, use daily data to measure immediate traction—and pivot quickly if something’s underperforming.
By checking in regularly, you can use these dashboards to stay proactive, not reactive—adjusting your strategy based on what’s happening today, not just what happened last month.
How often is data in this dashboard updated?
Data provided in the Daily Trends dashboard is calculated every 24 hours. The updated data becomes available to you four days after the day it’s calculated. For example, data gathered on Monday becomes available to you on Friday.
This allows you to track granular day-to-day trends in near real-time, making it ideal for campaign monitoring and rapid response.
Where does Semrush traffic data come from?
Traffic Analytics reports are based on petabytes of clickstream data that comes from multiple proprietary and 3rd party data sources, Semrush’s proprietary AI and machine learning algorithms, and Big Data technologies. The data is accumulated and approximated from the user behavior of over 200 million real internet users, and over a hundred different apps and browser extensions are used to collect it.
For more information about how Semrush turns traffic data into traffic intelligence, refer to our article here.
As Traffic Analytics data is not obtained from any website’s internal analytics, the numbers you see here might differ from what you see in your Google Analytics or similar trackers you use. However, if you want to analyze only your own website traffic without comparing it with others, we recommend that you refer to your own Google Analytics.
All numbers in Semrush Traffic Analytics are perfectly comparable, meaning you can match two or more websites in the tool and see how their metrics differ from each other in %.
What related Traffic & Market dashboards should I use?
To dive deeper, pair the Daily Trends dashboard with:
- Traffic Overview – For a monthly high-level view across traffic, devices, and engagement
- Channel-Specific Dashboards – Like Organic Search or Paid Social for detailed trends, sources, and top-performing pages
- Top Pages – To see which URLs are gaining or losing traction each day
- Market Overview – To understand how your performance compares to the broader market