The Audience Profile section of the Traffic & Market Toolkit delivers comprehensive insights about your competitors' audiences. These interactive dashboards reveal who visits specific websites, where audience segments overlap, and how different demographic groups engage across your market landscape.
With this data, user acquisition managers and marketing strategists can pinpoint audiences with the highest potential value and develop targeted approaches to convert them into customers.
The Audience Profile section provides:
- Deep understanding of audience demographics across age and gender segments
- Clear visualization of audience overlap between competitors
- Insights into high-potential partnership opportunities with related domains
- Data-driven foundation for audience segmentation and targeting strategies
- Competitive intelligence to identify underserved demographic segments
Use these insights to improve campaign targeting effectiveness and identify new business development opportunities.
Getting started with the Audience Profile dashboards
The Get Started menu is your entry point into the Semrush Traffic & Market Toolkit. It’s designed to help you quickly enter domains and move into your analysis of their traffic and marketing performance.
You’ll use this page to kick off your analysis—it’s your launchpad into the entire Traffic & Market experience.
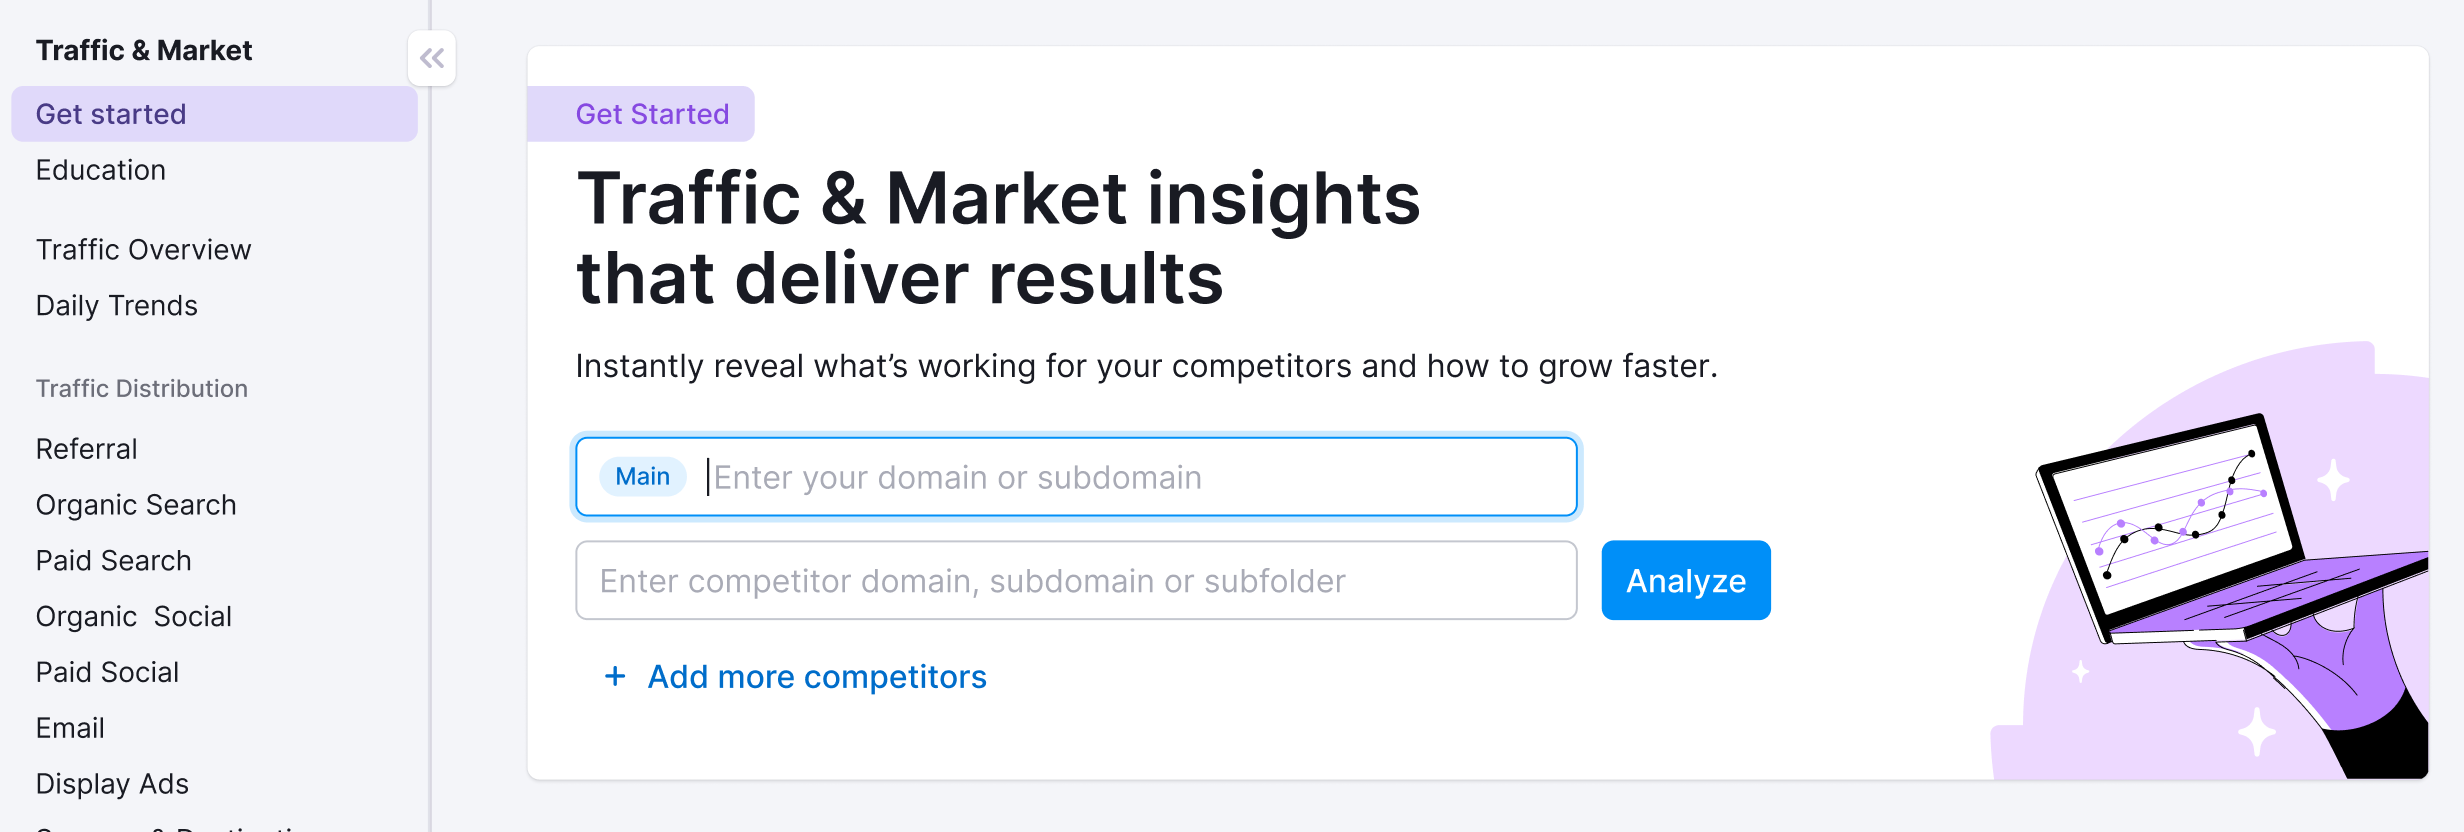
If you haven’t created any projects yet, you’ll see a search panel where you can:
- Type in a domain — Start by entering the main domain you’d like to analyze
- Add additional competitors — Use the “+ Add more competitors” link to compare multiple sites at once
- Click the “Analyze” button — This will pull up dashboards with data and charts, starting with the Traffic Overview dashboard
If you’ve already entered domains into the toolkit, you’ll see them saved as “Folders” and you can access them anytime.
In this case, you’ll see your saved folders listed on the Get Started screen. Click any one of them to jump straight into your dashboards and pick up right where you left off.
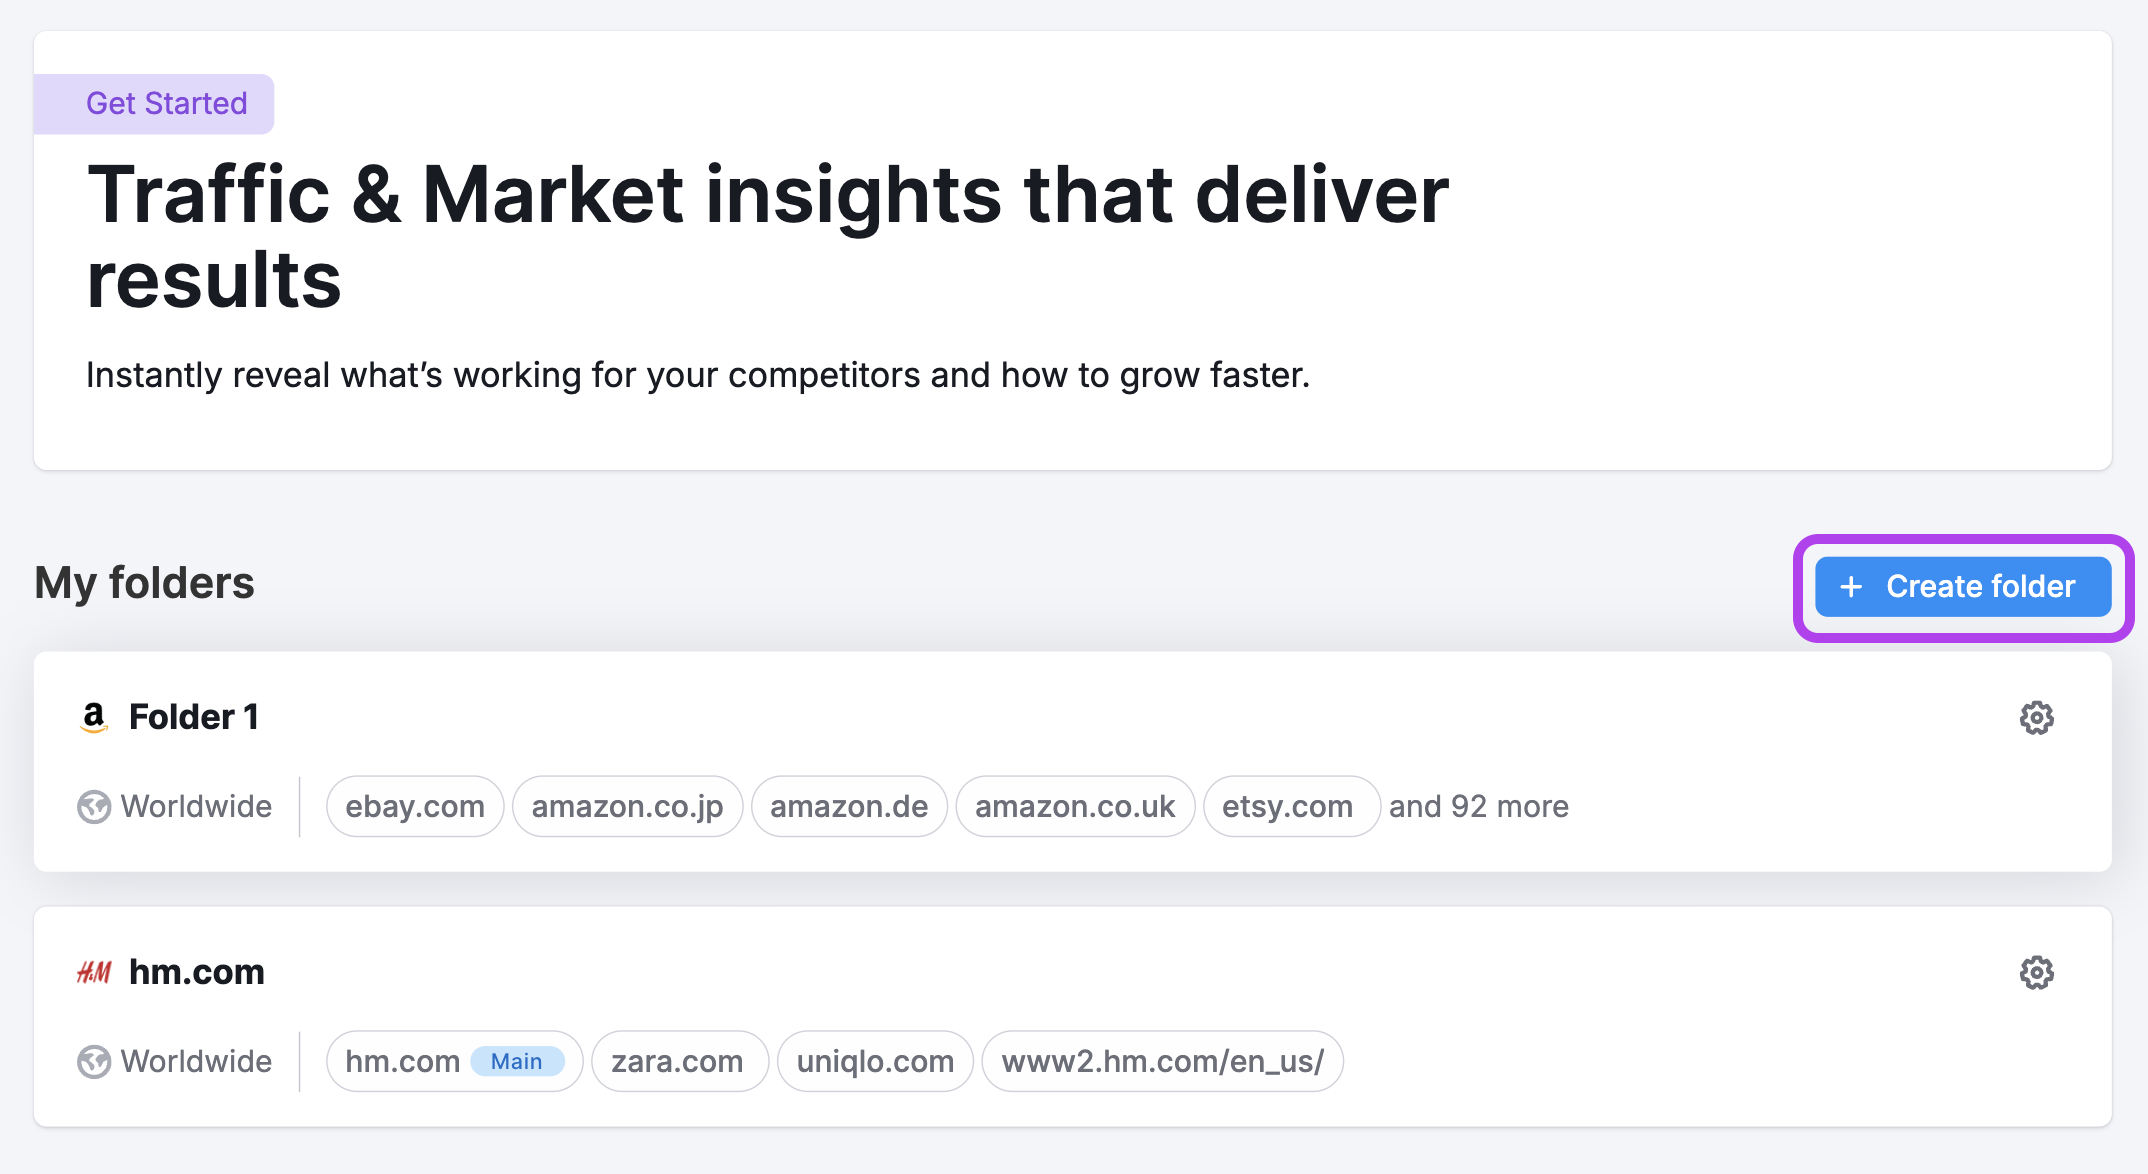
Use the “Create Folder” button to start a new project whenever you're analyzing a new domain or market.
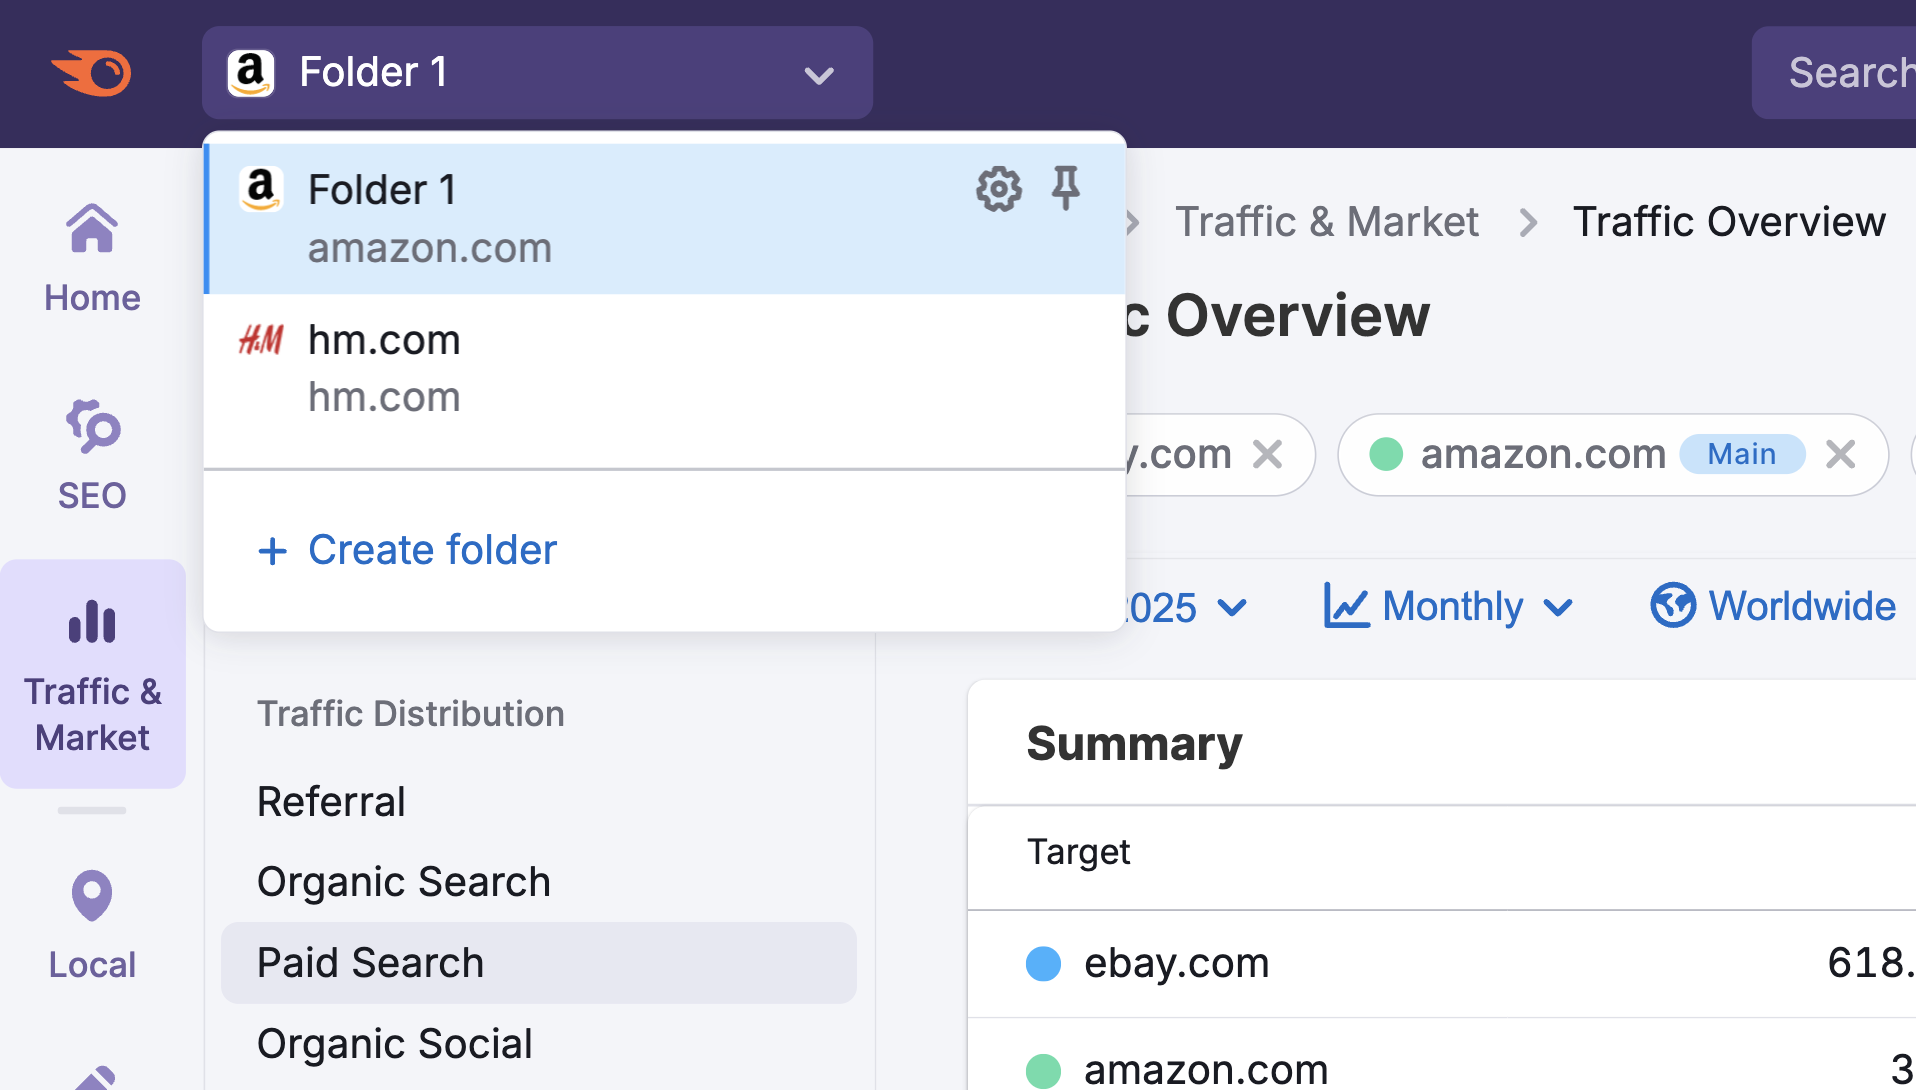
Note: At any time—no matter which dashboard you're on—you can click the Folders dropdown in the upper left corner of the dashboard to select another folder or add more competitors to your analysis without losing your place.
What dashboards and data will I find in the Audience Profile section?
The Audience Profile section features two dedicated dashboards that help marketing strategists and audience development directors deeply analyze their market:
Demographics Dashboard
The Demographics dashboard provides a detailed breakdown of the audience for a specific domain or market. This includes essential demographic data such as:
- Age distributions: See how your audience is split across different age ranges.
- Gender breakdowns: Understand the male/female balance within your audience.
- Market or domain-specific insights: View demographics at both the individual site and broader market levels.

With these insights, marketers can identify age-specific targeting opportunities to reallocate budgets based on gaps that competitors aren’t covering. The dashboard also helps uncover gender-based preferences, supporting the development of content strategies for underserved segments.
By understanding these key demographic details, you can fine-tune campaign messaging and creative assets to better connect with the most relevant audience groups and drive more effective marketing outcomes.
Audience Overlap Dashboard
The Audience Overlap dashboard visualizes how audiences are shared among market domains, with features like:
- Audience share percentages: See what percentage of the total audience visits a particular site.
- Cross-competition overlap: Understand how much of your audience is shared with competing websites.
- Venn diagram visualizations: Instantly spot overlapping and unique audience segments between multiple domains.

This dashboard makes it possible to discover untapped audience segments by revealing which competitors are engaging specific audiences, and where there are gaps. You can use these insights to prioritize partnership or advertising opportunities with high-traffic domains that already engage your ideal customers.
Ultimately, understanding audience overlap allows you to optimize your marketing strategies and target unique or underserved segments for greater growth.
Where does Audience Profile data come from?
Our audience data is generated using a combination of third-party data and our own proprietary AI and machine learning algorithms.
The third-party data comes from several companies engaged in social demographics research. These data providers develop panels (audience groups), gather raw data, and aggregate it. We then process this aggregated data to train our machine learning models, allowing us to predict metrics for various sites across the web.
Because the data we use is anonymized, the data provided in the Audience Profile section reflects domains, not individual users. In addition, we don’t obtain data from any website’s internal analytics, so the numbers you see here may differ from what you see in your Google Analytics.
If you want to analyze your own audience data without comparing it to other domains, refer to your site’s Google Analytics.
What related Traffic & Market dashboards should I use?
To expand your analysis, pair the Audience Profile dashboards with:
USA Dashboard – To analyze traffic patterns and engagement metrics for visitors from the United States
Countries Dashboard – To compare international traffic distribution and identify top-performing global markets
Channel-Specific Dashboards – Use Organic Search, Paid Social, Referral, and other channel dashboards to uncover trends, entry sources, and landing pages gaining momentum.