The Demographics dashboard is part of the Semrush Traffic & Market Toolkit. It helps you break down audience insights across three essential dimensions: age, sex, and geographic location. You can also view unique visitor trends across any domain or set of competitors.
Use this dashboard to understand your market audience—and how it’s distributed among competitors. Whether you're building personas, launching a campaign, or identifying new markets, this data gives you the foundation for smarter targeting and strategy.
Getting started with the Demographics dashboard
The Get Started menu is your entry point into the Semrush Traffic & Market Toolkit. It’s designed to help you quickly enter domains and move into your analysis of their traffic and marketing performance.
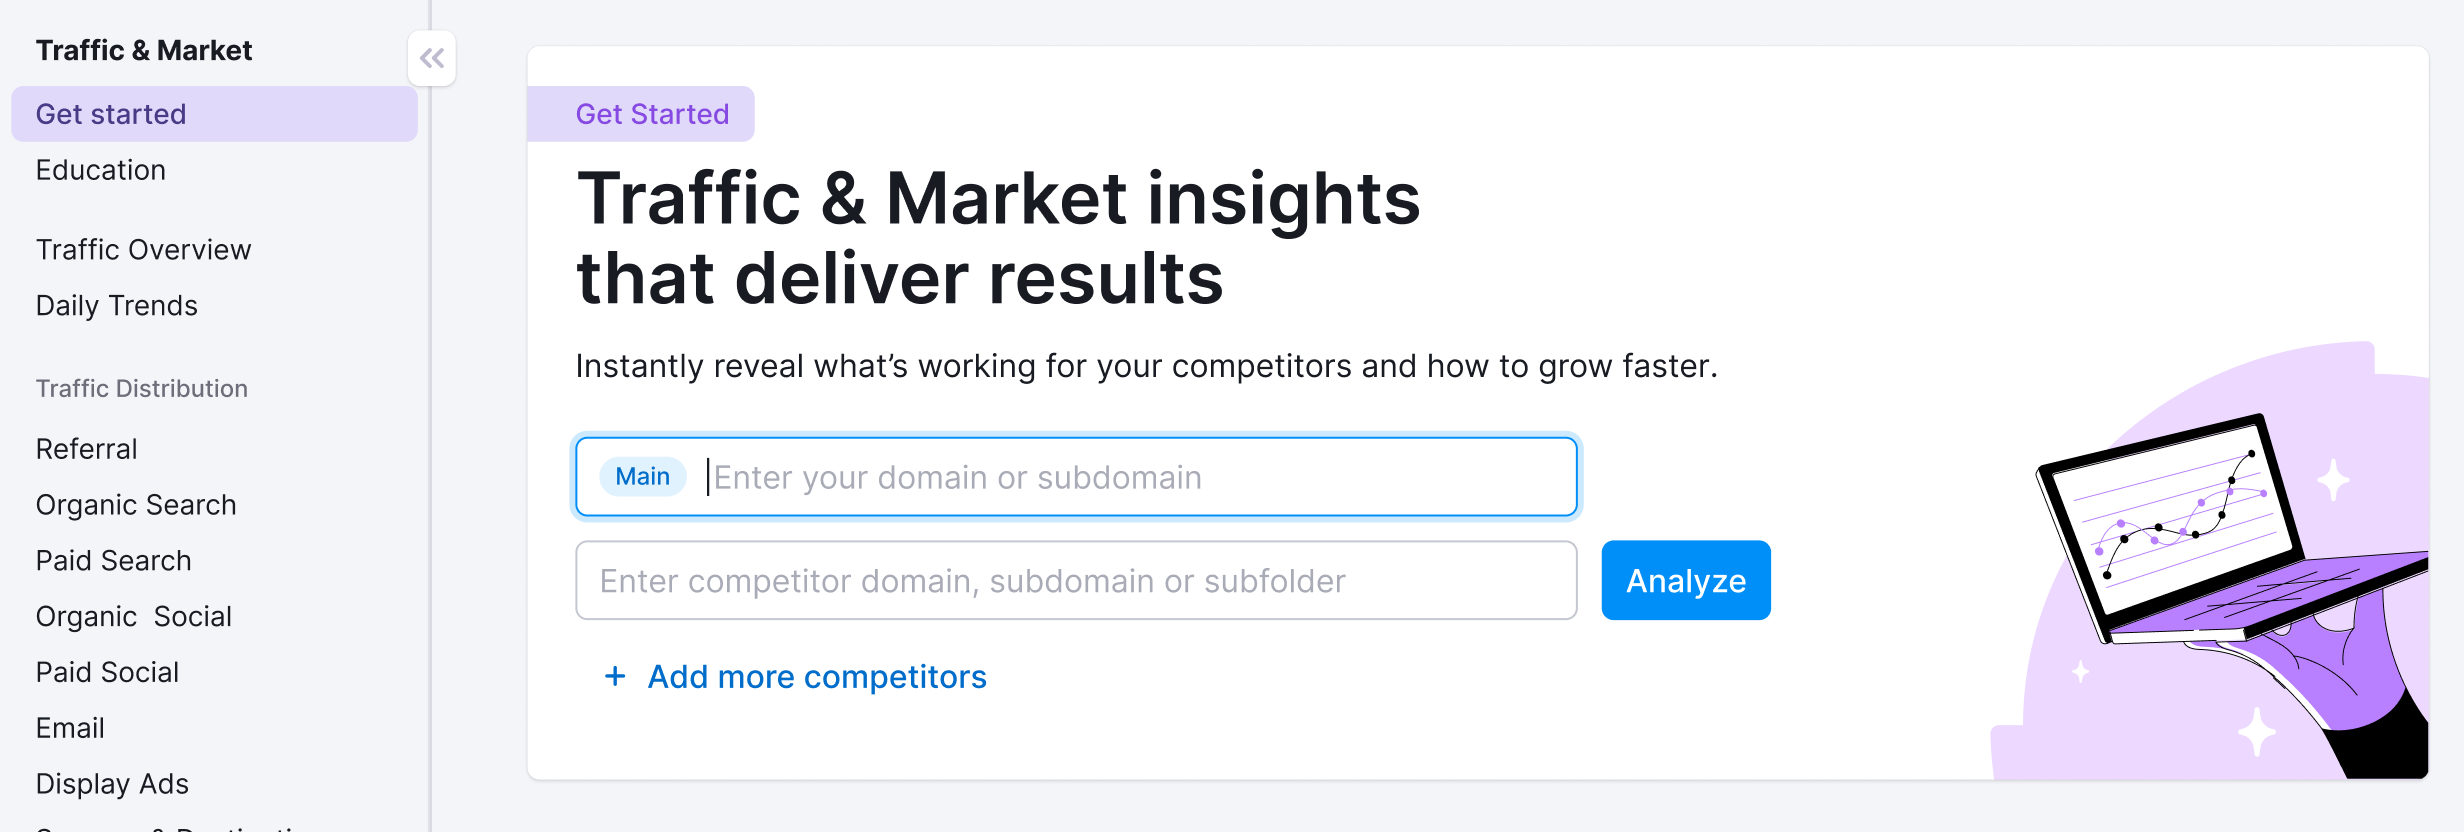
You’ll use this page to kick off your analysis—it’s your launchpad into the entire Traffic & Market experience.
If you haven’t created any projects yet, you’ll see a search panel where you can:
- Type in a domain — Start by entering the main domain you’d like to analyze
- Add additional competitors — Use the “+ Add more competitors” link to compare multiple sites at once
- Click the “Analyze” button — This will pull up dashboards with data and charts, starting with the Traffic Overview dashboard
If you’ve already entered domains into the toolkit, you’ll see them saved as “Folders” and you can access them anytime.
In this case, you’ll see your saved folders listed on the Get Started screen. Click any one of them to jump straight into your dashboards and pick up right where you left off.
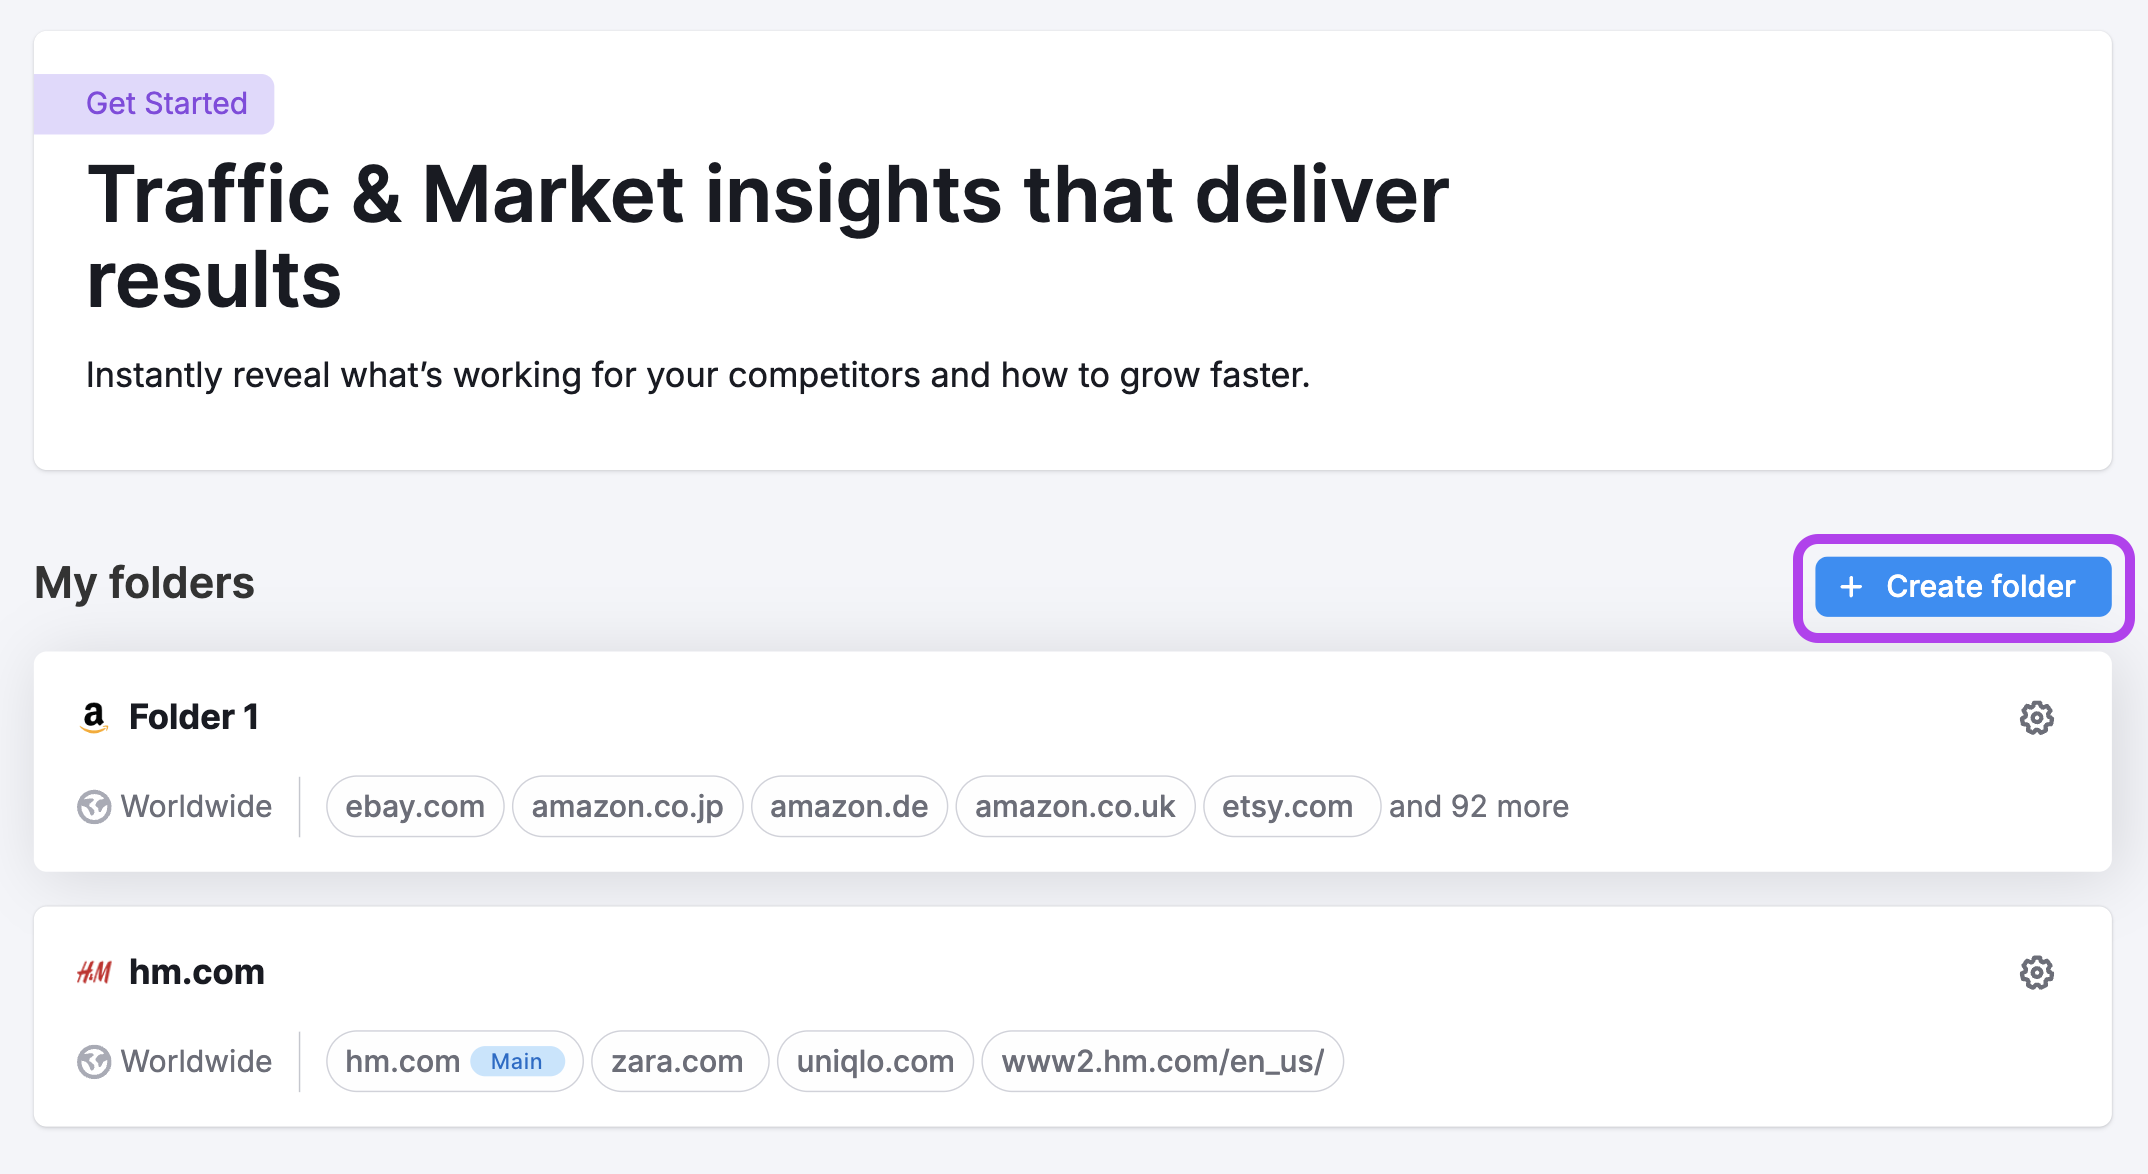
Use the “Create Folder” button to start a new project whenever you're analyzing a new domain or market.
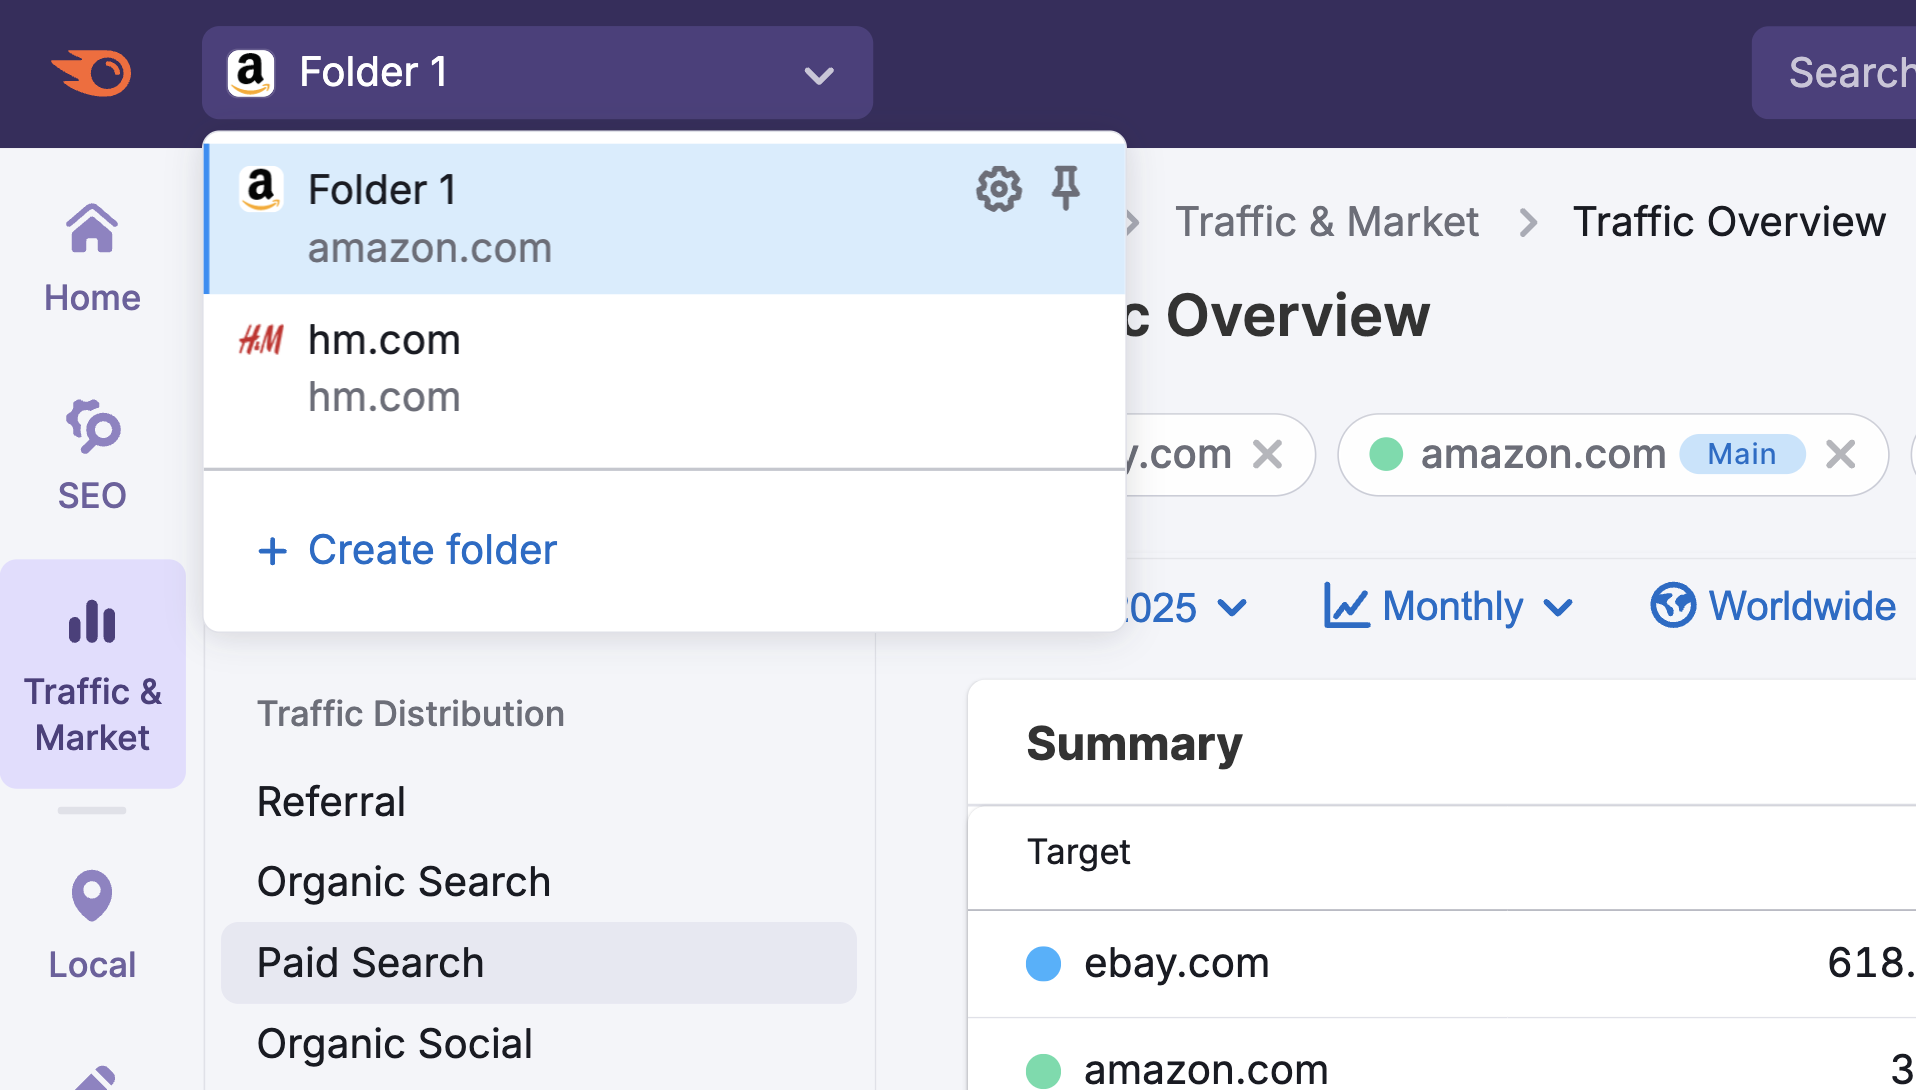
Note: At any time inside any dashboard, you can select the Competitor list drop-down in the upper left to edit your current list or create a different one without losing your place.
How to use the Demographics dashboard
The Demographics dashboard is interactive and customizable. Use the filters at the top of the page to tailor your analysis and explore traffic flows in detail. Start by selecting your date range, location, and device type preferences.

The Audience section of the dashboard shows who is visiting each selected domain by age group and gender. You’ll see two key visualizations:
- A bar chart showing the age distribution across domains
- A side-by-side comparison of male vs. female traffic percentages per domain
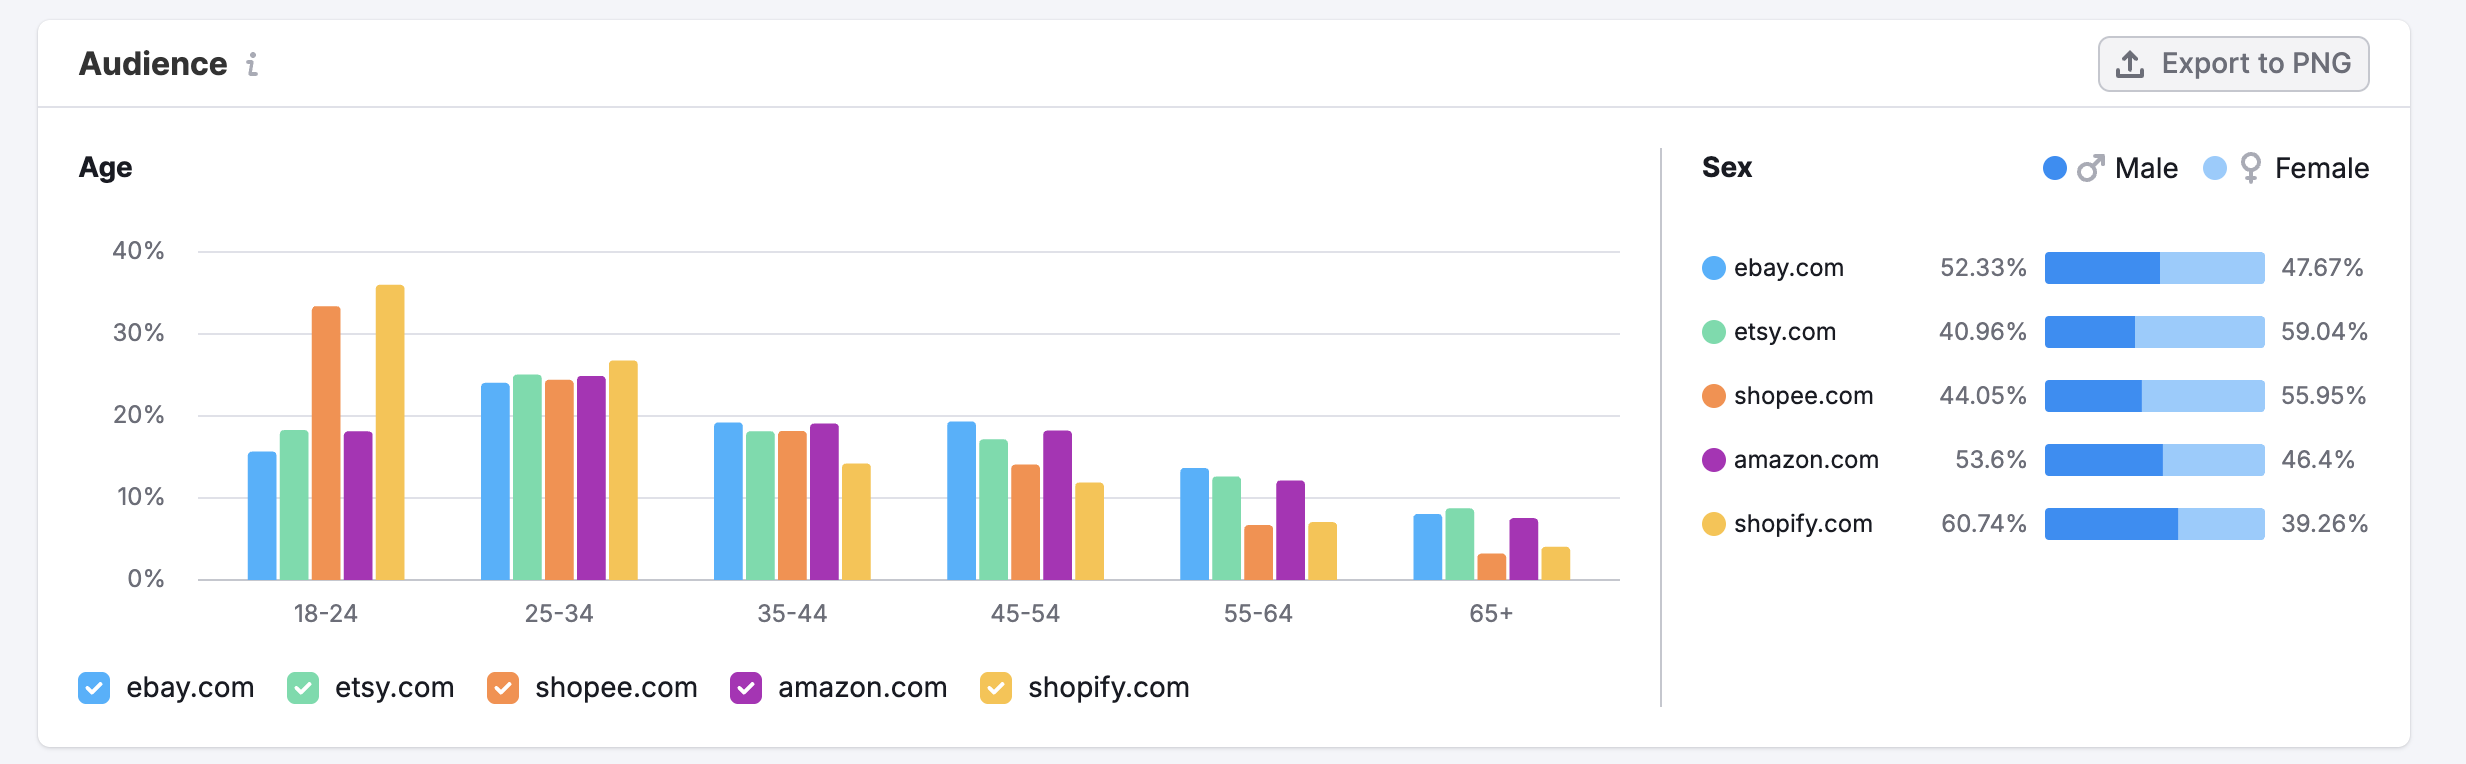
Use this section to quickly spot differences in audience composition across competitors.
The unique visitor graph tracks how many individual users visited each selected domain over time. It displays:
- A trend line showing total unique visitors month by month
- Comparisons across all selected domains
At the top of this section, you can:
- Select Months or Quarters to adjust the reporting period
- Use the Granularity selector in the upper right to switch between monthly and quarterly views

Use this section to benchmark audience size and observe growth or decline trends.
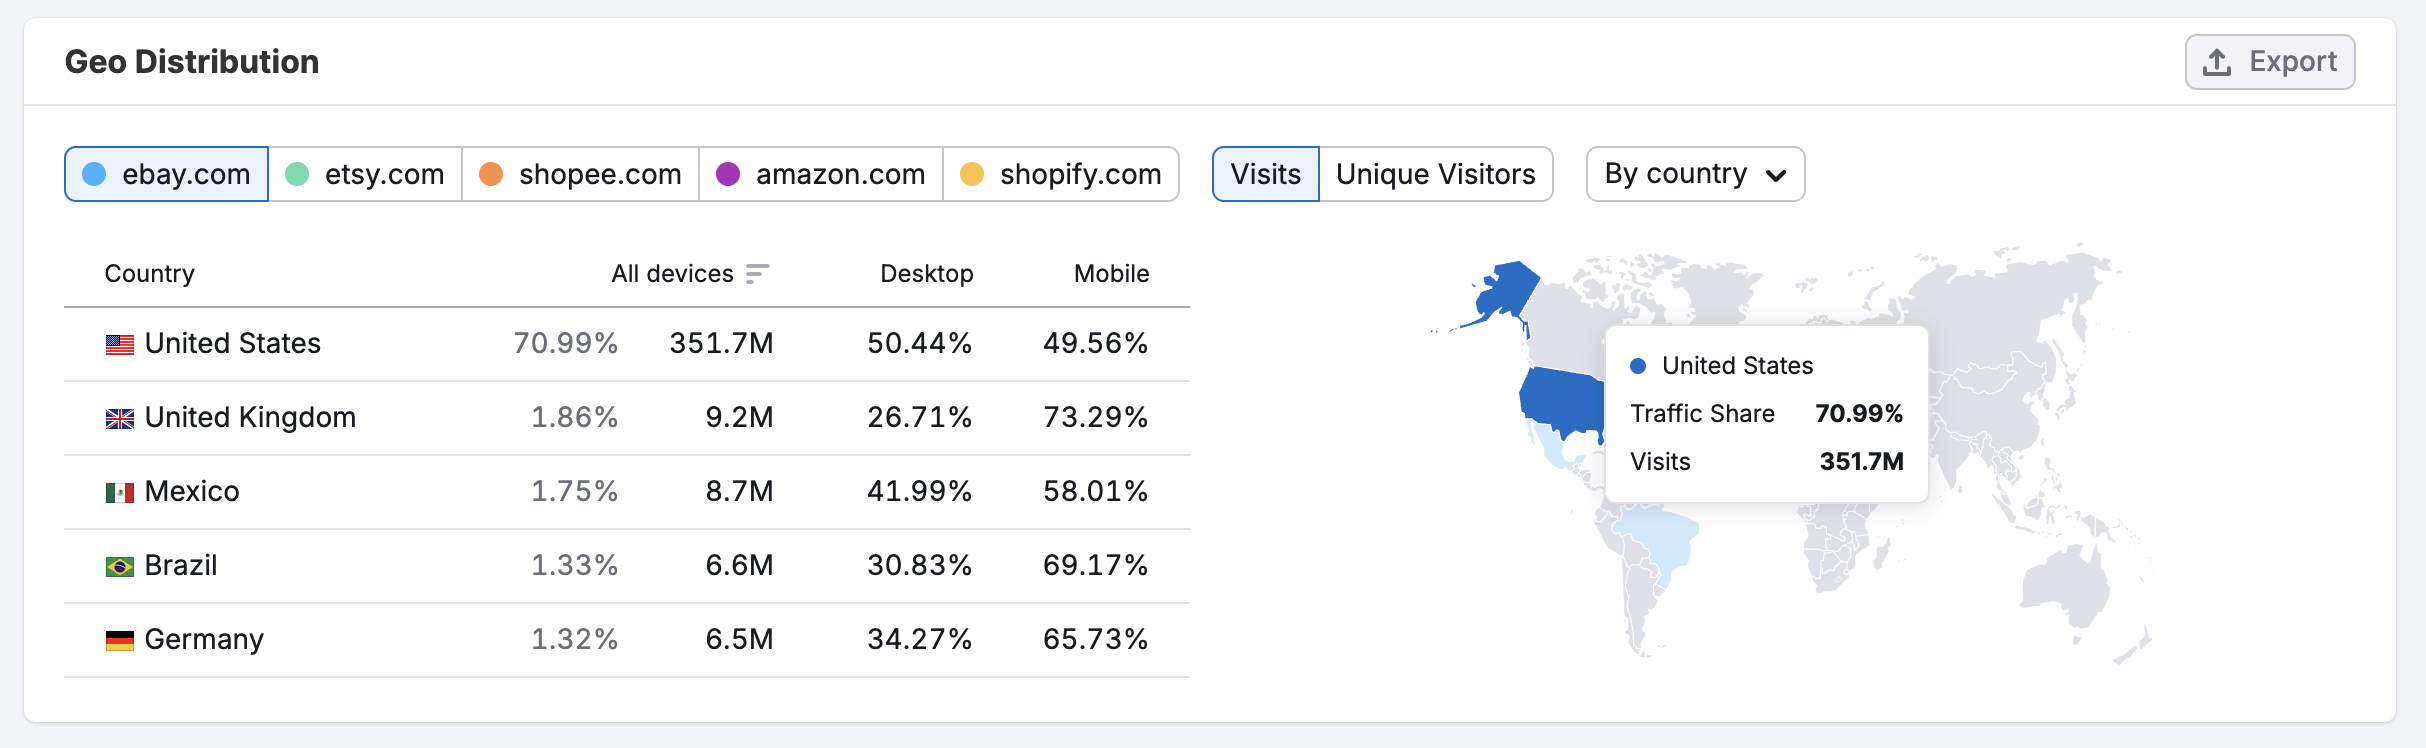
Finally, you’ll see the Geo Distribution section. This area highlights where traffic is coming from. It includes:
- A global map showing the top traffic-contributing countries
- A table that breaks down traffic share by country, visit volume, and desktop vs. mobile device usage for the top 5 countries.
At the top of the table, use the filters to:
- Select a specific domain to analyze
- Adjust by Visit type (Visit or Unique Visit)
- Filter the map by Region, Country, or Business region
Use this section to assess geographic reach and identify strong or weak regions across each domain.
By combining demographic, geographic, and visitor trend data in one place, the Demographics dashboard gives you a clear view of who your audience is—and how that compares to your competitors. These insights help you refine targeting, uncover new opportunities, and build smarter, more effective marketing strategies.
How can I act on the insights found in the Demographics dashboard?
This dashboard helps you understand who your competitors are reaching—and who you might be missing. Here's how you can put the data to work:
- Refine audience targeting: If a competitor is strong among younger audiences or a specific gender, tailor your ad campaigns to reclaim attention from those groups.
- Find new segments and market gaps: Spot under-served demographics and build campaigns or product offerings around those opportunities.
- Prioritize regions: Focus budget and effort on countries or regions where you already have traction—or where a competitor is thriving.
- Adjust platform mix: Domains with younger or mobile-heavy audiences may benefit from more investment in social or mobile-first content strategies.
What related Traffic & Market dashboards should I use?
For a more complete audience and traffic picture, pair the Demographics dashboard with:
- Audience Overlap – See which domains share the same audience and how much overlap there is.
- Top Pages – Learn which content or products drive traffic for audiences across age, region, and gender.
- Sources & Destinations – Understand where traffic is coming from and going to after visiting a domain.
- Traffic Overview – Benchmark high-level traffic trends to support your demographic insights with volume and engagement data.
- Geographical Regions – Dig deeper into regional performance trends across business or geographic zones.
Together, these dashboards give you a well-rounded view of your audience—who they are, where they’re coming from, and how they engage across the competitive landscape.