The Subfolders & Subdomains dashboard is part of the Semrush Traffic & Market Toolkit. It helps you analyze how traffic is distributed across different parts of competitor websites—either by subdomains (e.g., blog.example.com) or subfolders (e.g., example.com/blog). This gives you a clearer view into content performance, site architecture, and potential entry points driving the most engagement.
Use this dashboard to identify high-performing sections of a site, spot new initiatives or campaigns, compare structural strategies across competitors, and better understand how content is organized and consumed.
Getting started with the Subfolders & Subdomains dashboard
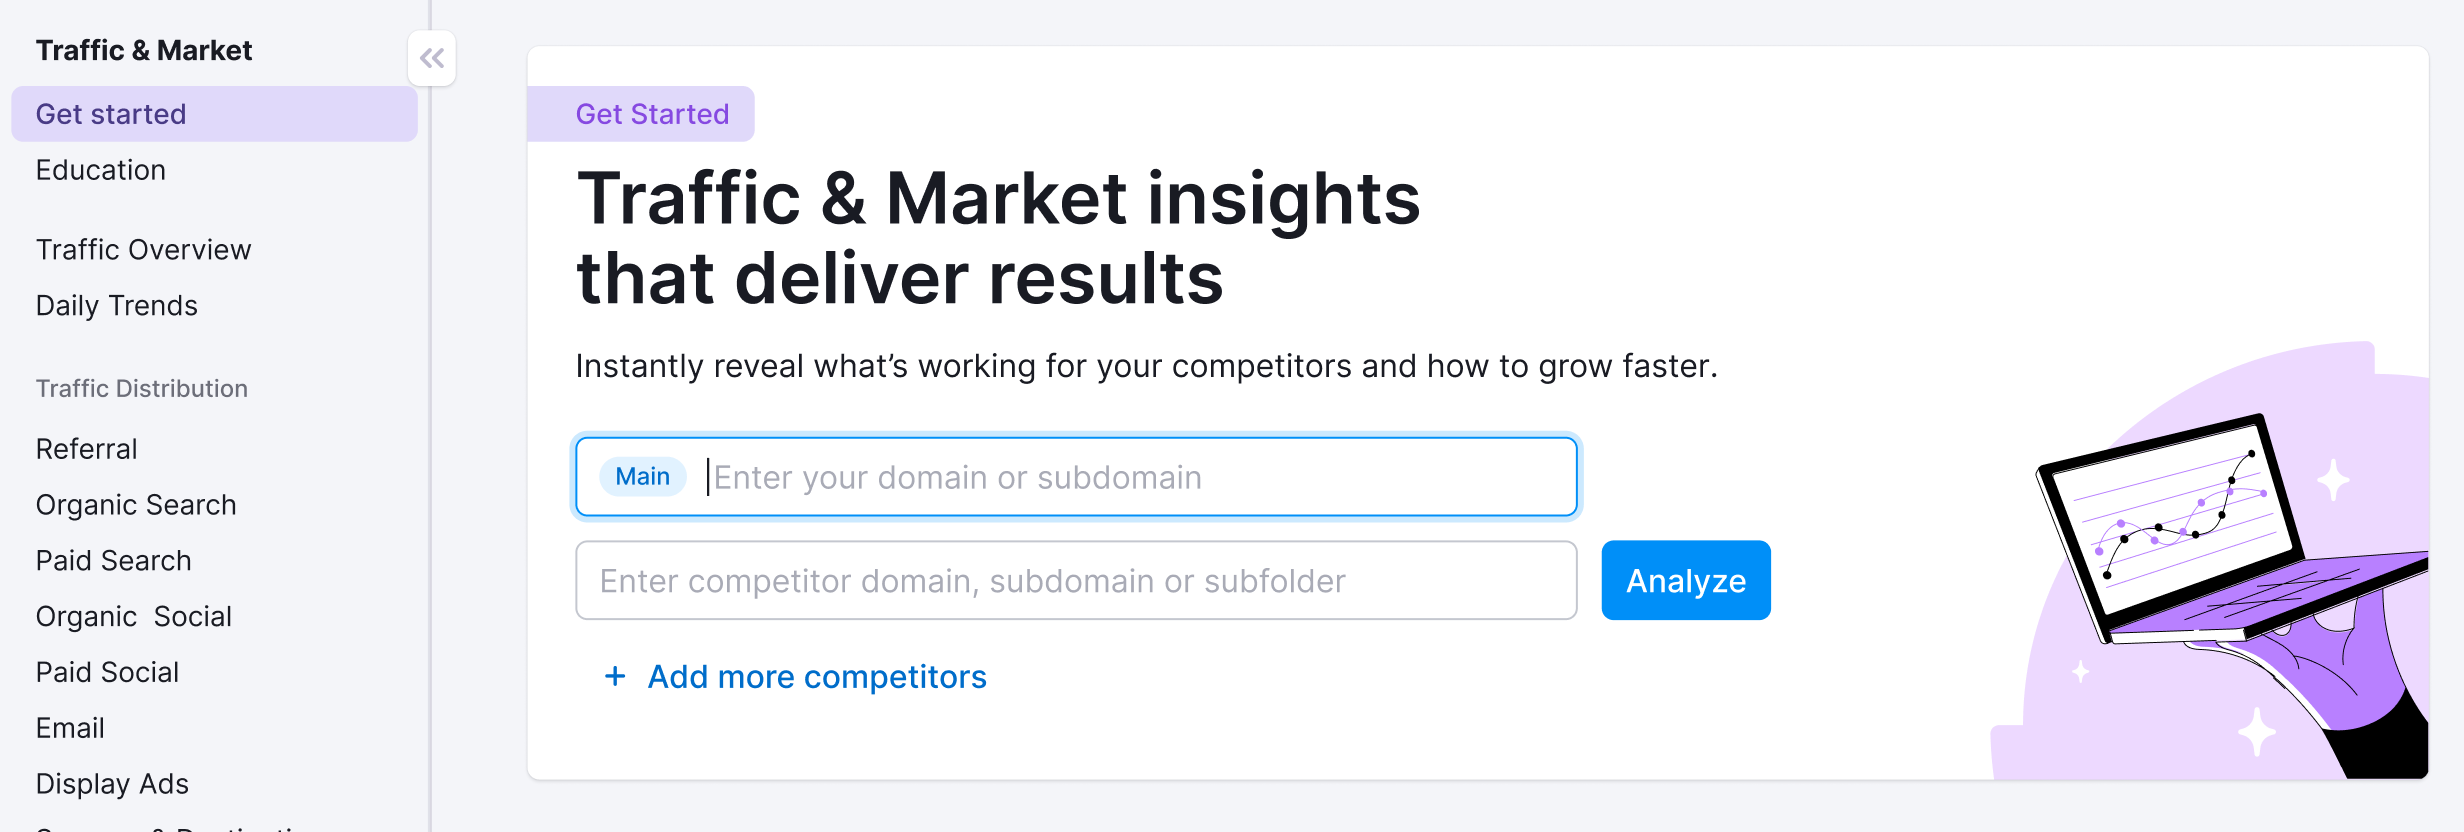
The Get Started menu is your entry point into the Semrush Traffic & Market Toolkit. It’s designed to help you quickly enter domains and move into your analysis of their traffic and marketing performance.
You’ll use this page to kick off your analysis—it’s your launchpad into the entire Traffic & Market experience.
If you haven’t created any projects yet, you’ll see a search panel where you can:
- Type in a domain — Start by entering the main domain you’d like to analyze
- Add additional competitors — Use the “+ Add more competitors” link to compare multiple sites at once
- Click the “Analyze” button — This will pull up dashboards with data and charts, starting with the Traffic Overview dashboard
If you’ve already entered domains into the toolkit, you’ll see them saved as “Folders” and you can access them anytime.
In this case, you’ll see your saved folders listed on the Get Started screen. Click any one of them to jump straight into your dashboards and pick up right where you left off.

Use the “Create Folder” button to start a new project whenever you're analyzing a new domain or market.
Note: At any time inside any dashboard, you can select the Competitor list drop-down in the upper left to edit your current list or create a different one without losing your place.

How to use the Subfolders & Subdomains dashboard
The Subfolders & Subdomains dashboard is interactive and customizable. Use the filters at the top of the page to tailor your analysis and explore traffic flows in detail. Start by selecting your date range, location, and device type preferences.

At the top of the dashboard, you'll see two tabs:
- Subfolders: View performance data based on URL structure within the root domain (e.g., /news, /store).
- Subdomains: View performance by subdomains (e.g., blog.domain.com, support.domain.com).
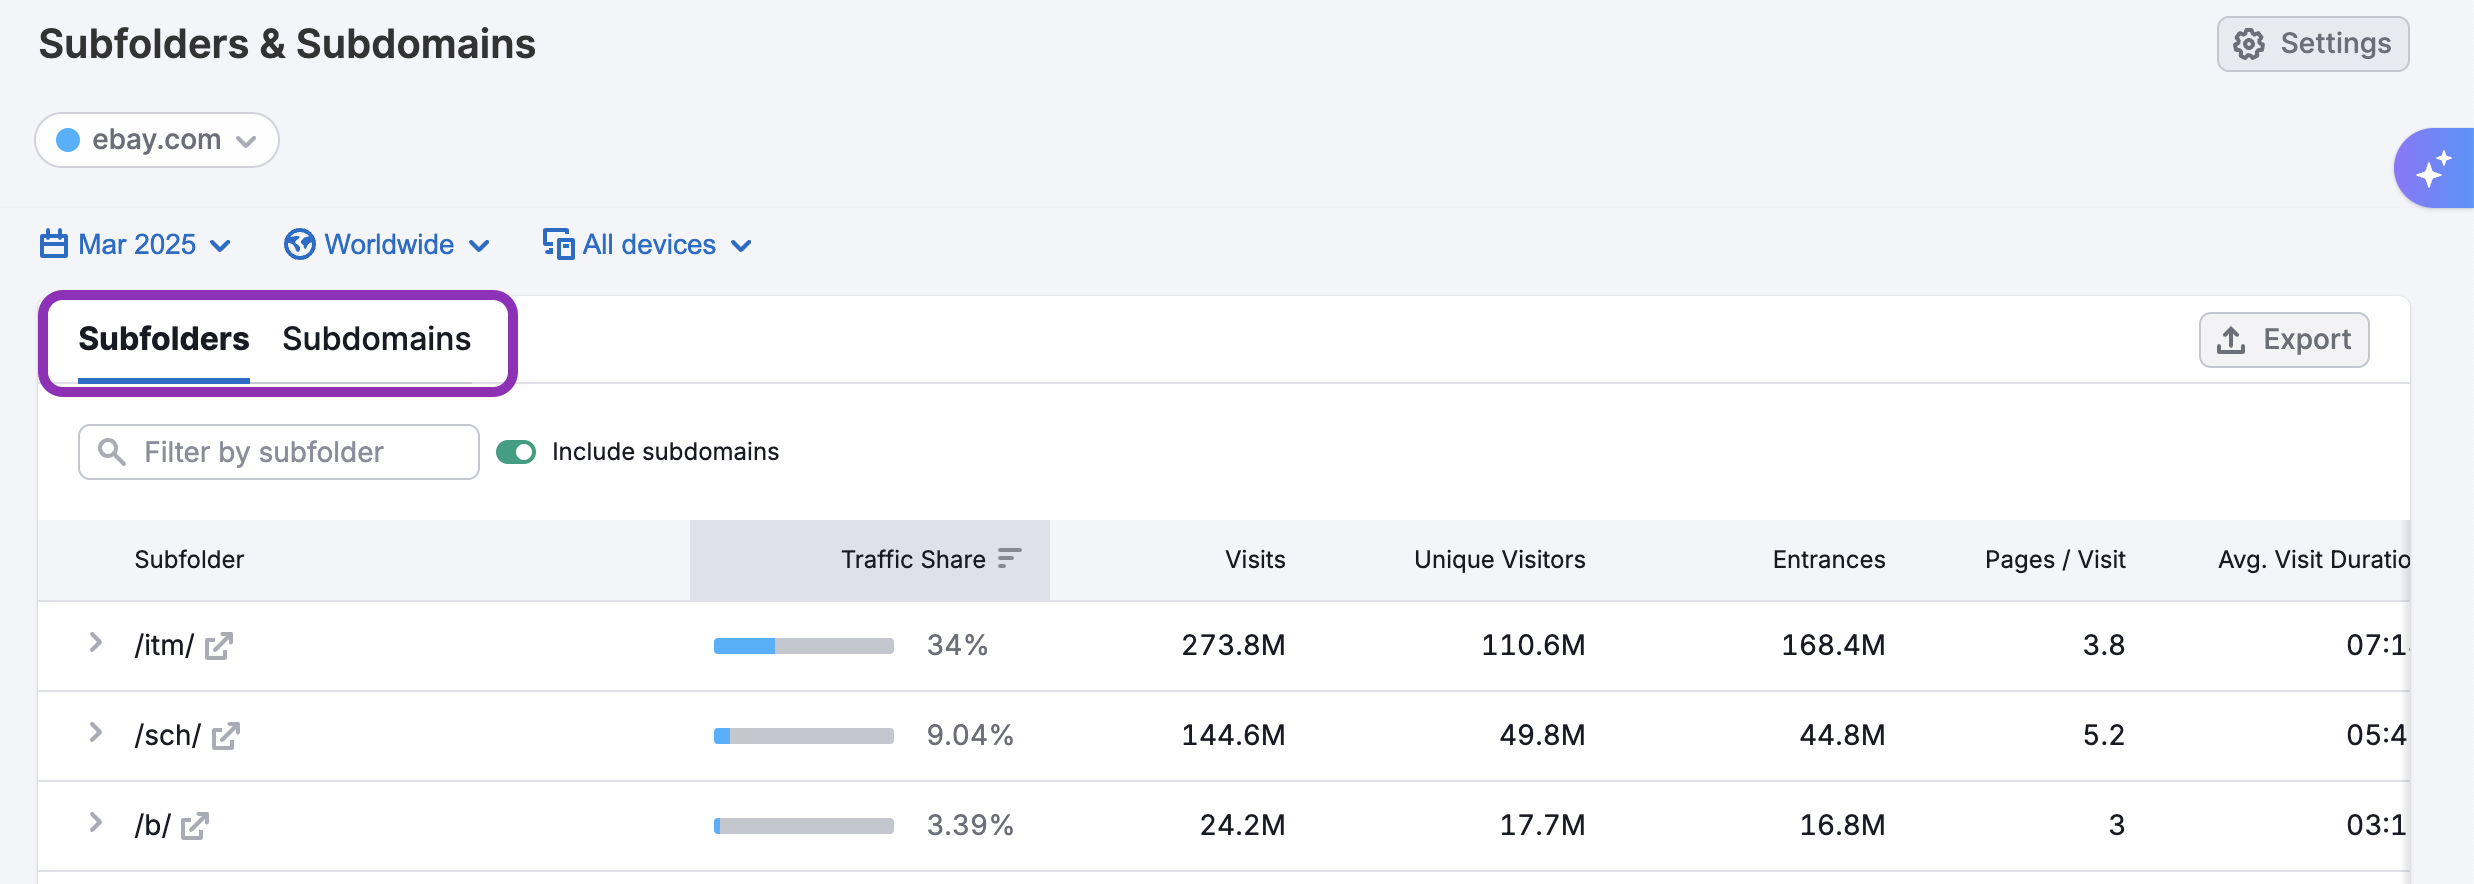
Switch between these tabs to gain insights into how a site’s structure supports its traffic flow—whether the domain relies more on nested folders or standalone subdomains.
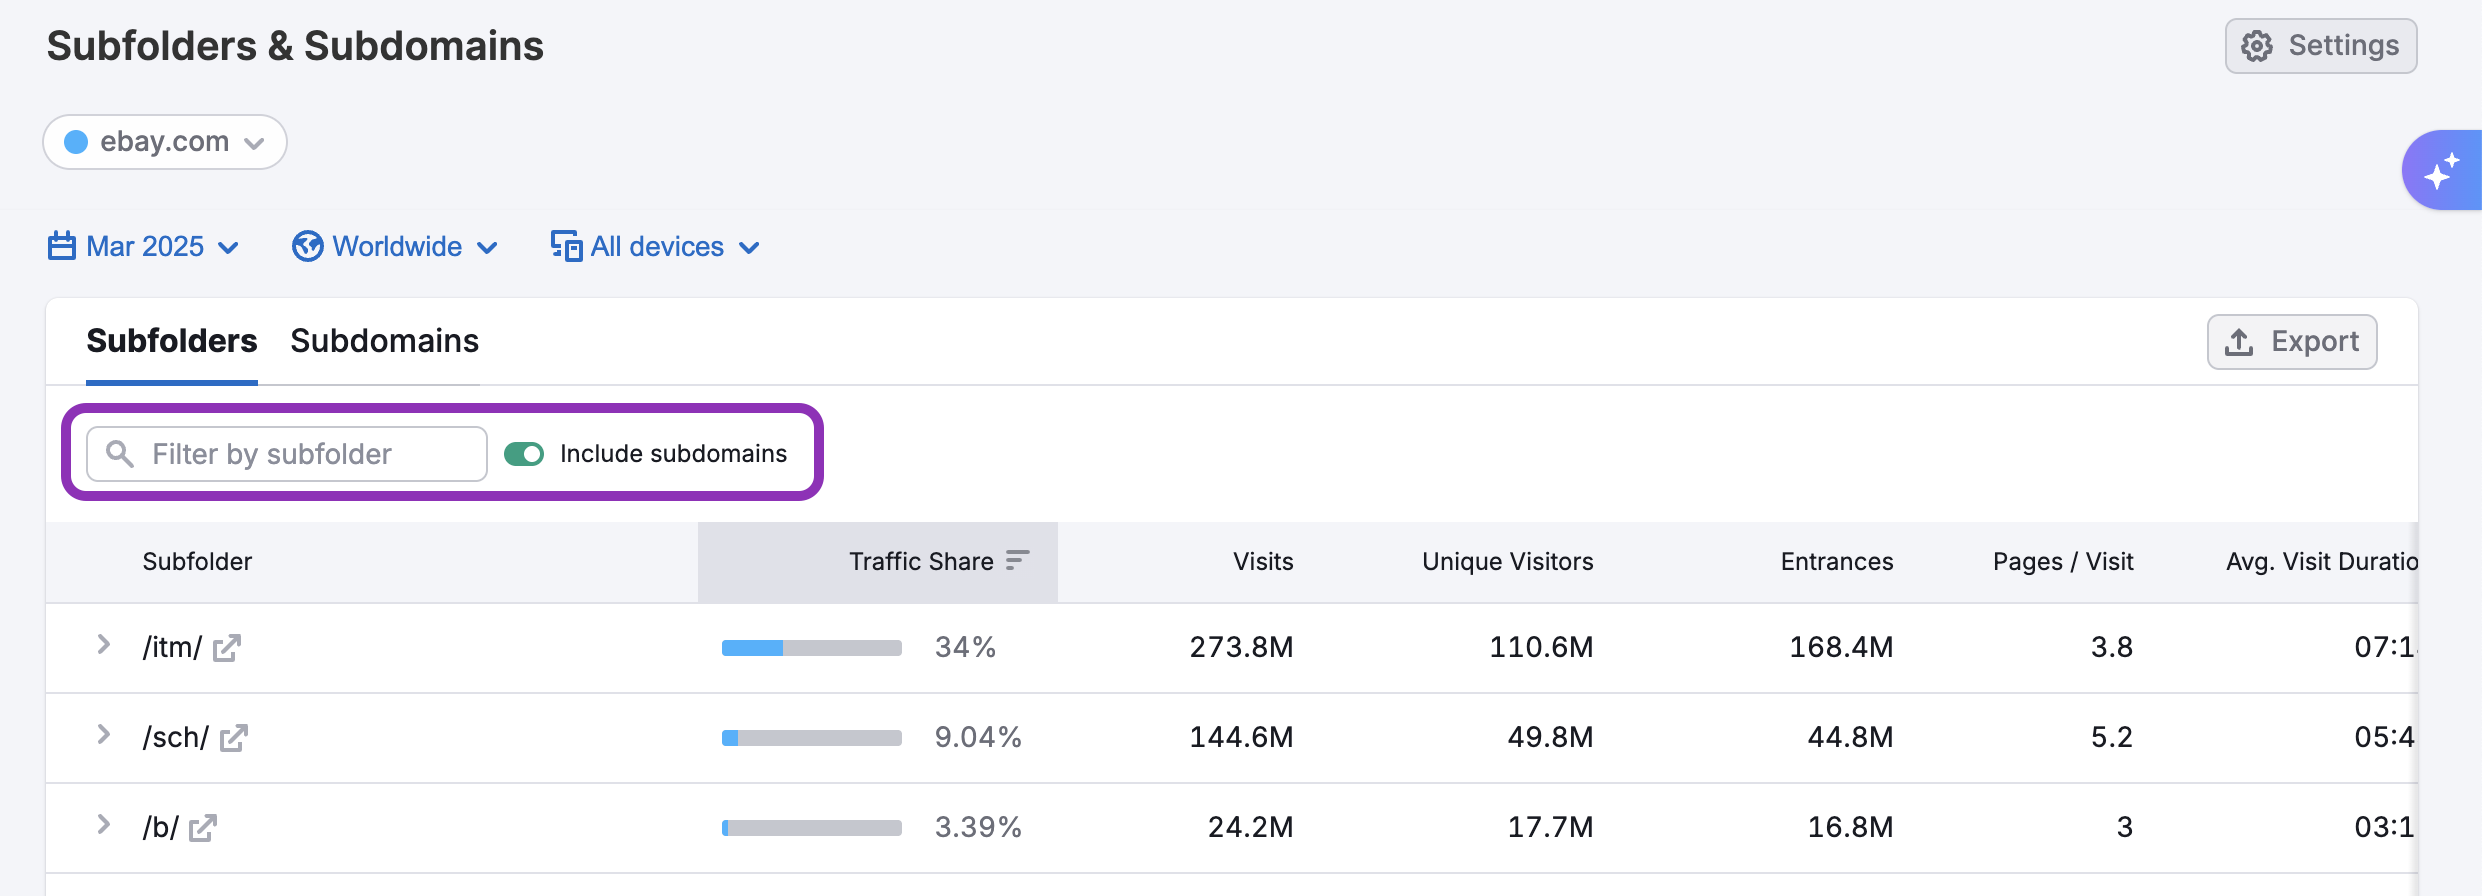
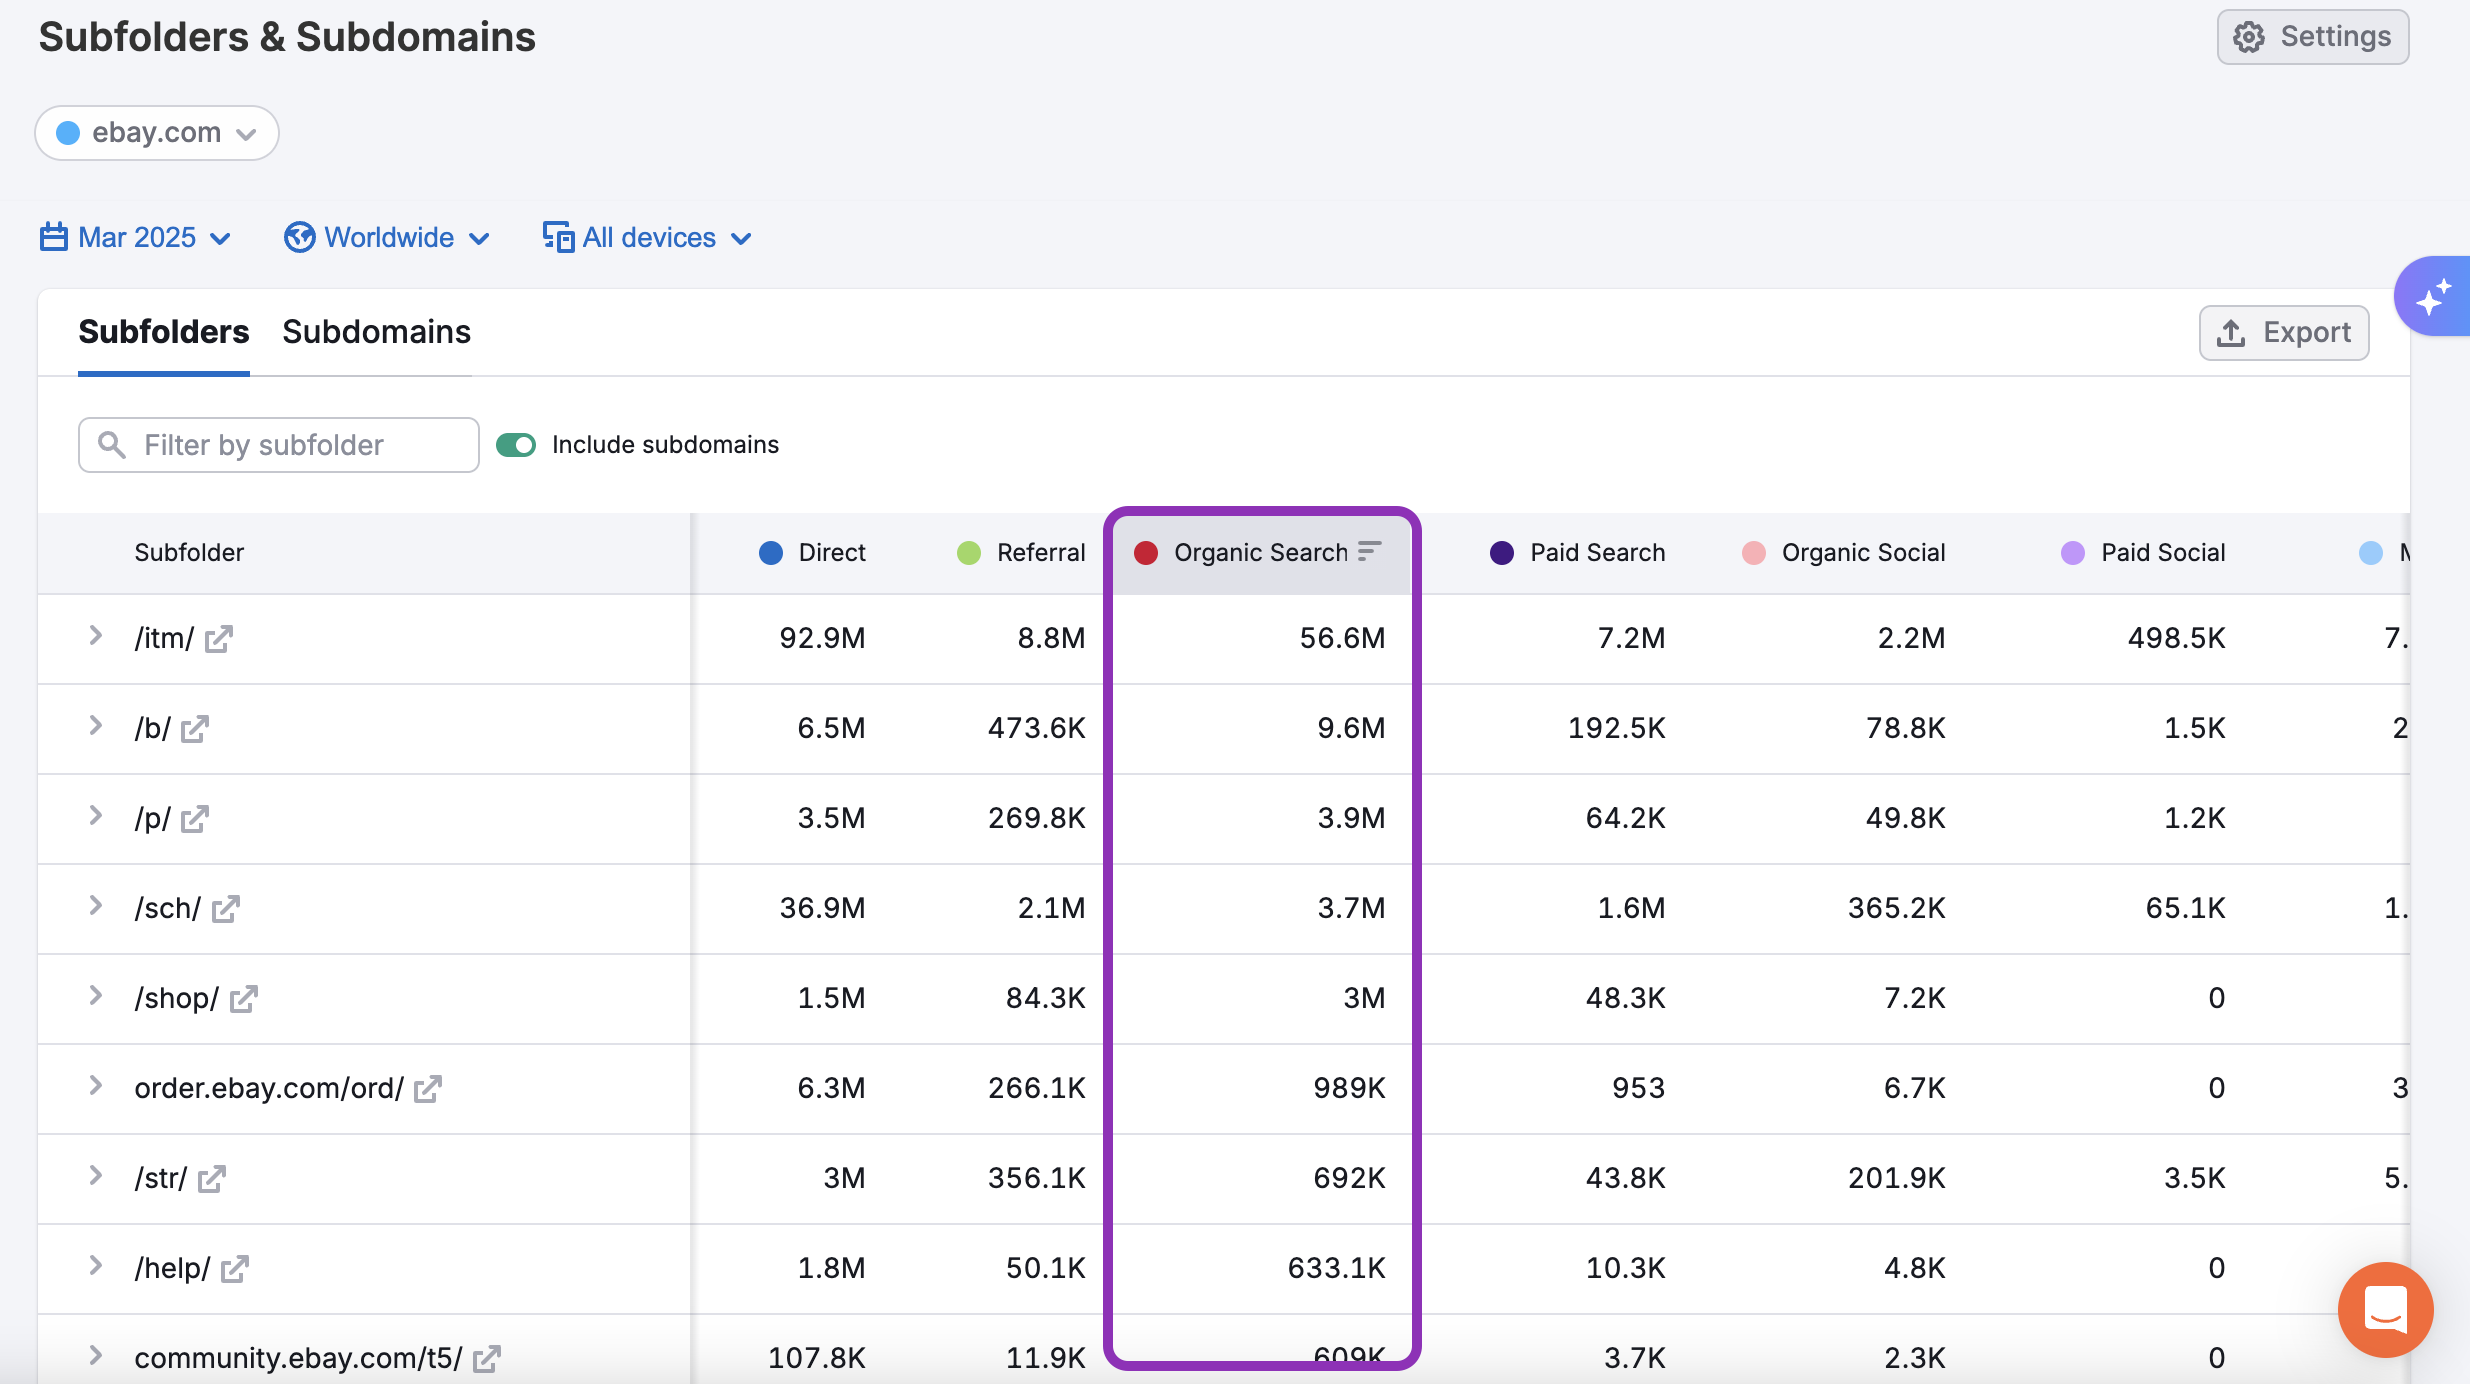
The main table below gives a full breakdown of either subfolder or subdomain performance depending on the tab selected. You can filter it by subfolder or subdomain using the search bar at the top of the table. In the Subfolders view, you also have the option to Include Subdomains in the table by toggling the switch on.
The table includes the following columns:
- Page – The specific subfolder or subdomain being analyzed
- Traffic Share – The % of total site traffic landing on that section
- Visits – Total number of visits
- Unique Visitors – Count of distinct users
- Pages / Visit – Avg. number of pages viewed during a visit
- Avg. Visit Duration – Time spent on site
- Exits – Total number of times users exited the site from that folder/subdomain
- Bounce Rate – % of single-page sessions

These metrics give you visibility into how each subdomain or subfolder is performing.
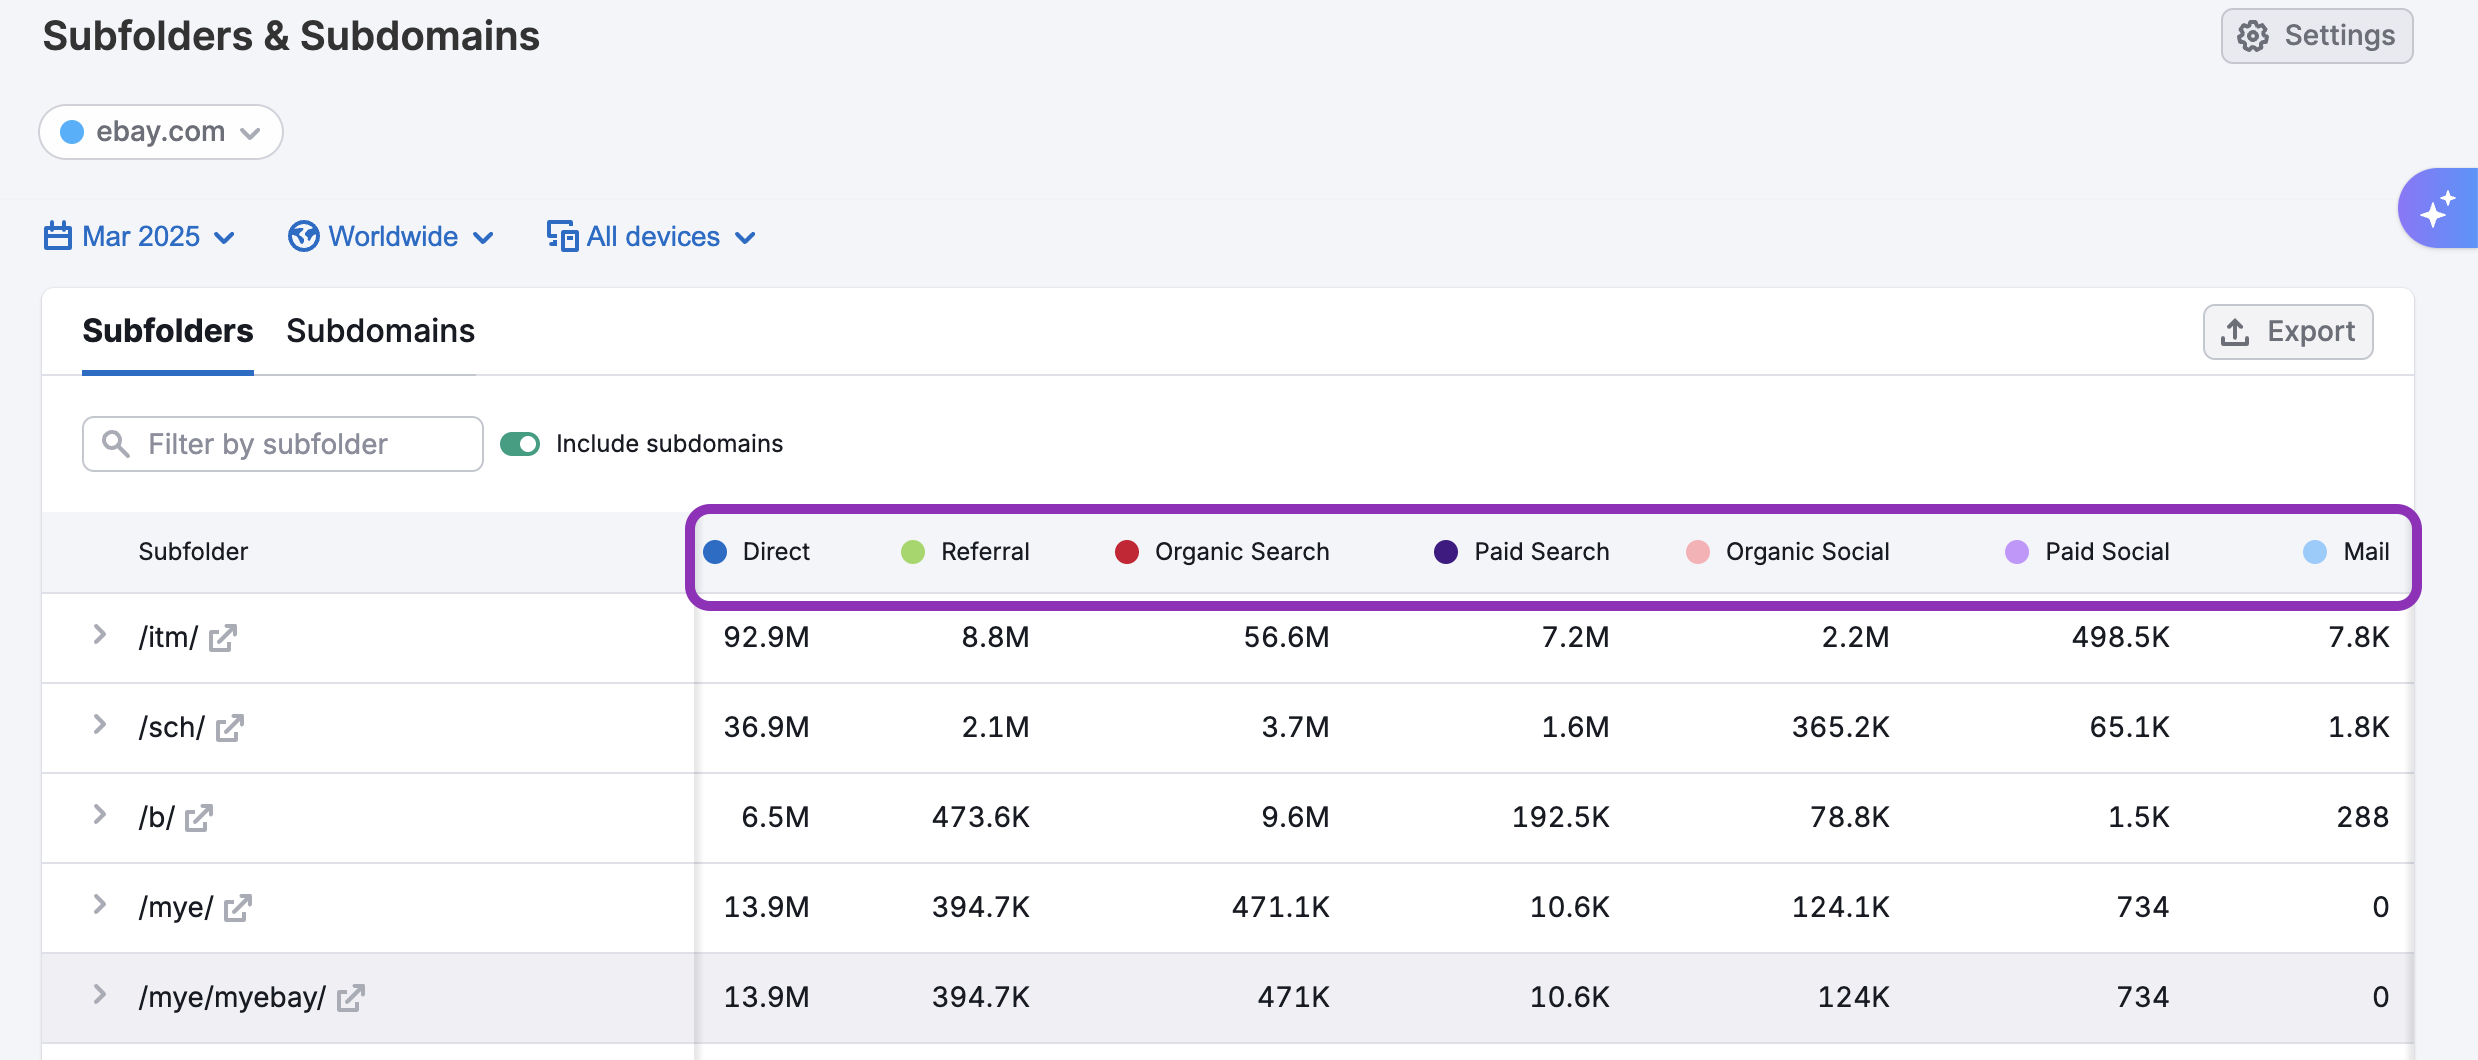
By scrolling across the table, you’ll discover a column for each of the key traffic channels including:
- Direct
- Referral
- Organic Search
- Paid Search
- Organic Social
- Paid Social
- Display Ads
You can sort the table by clicking on any column header—like Visits, Unique Visitors, or Traffic Share—to bring the highest-performing subfolders or subdomains to the top of the list. This makes it easy to identify which sections of a site are attracting the most attention across different metrics.
Each folder or subdomain entry also includes a drop-down menu packed with deeper insights. Click on any row to expand it and uncover detailed performance data specific to that section of the site.
Click any subfolder or subdomain row to open a drop-down with three tabs:
- Visits– See where visitors are coming from. This view breaks down traffic sources by channel (like Direct, Search, Referral) in a pie chart, with visit counts and percentages.
- Top Pages– Discover which URLs inside the subfolder or subdomain drive the most traffic. Metrics include page URL, unique visitors, unique pageviews, and traffic share.
- Traffic Trend– Track performance over time with charts for visits, unique visitors, pages per visit, average visit duration, and bounce rate.
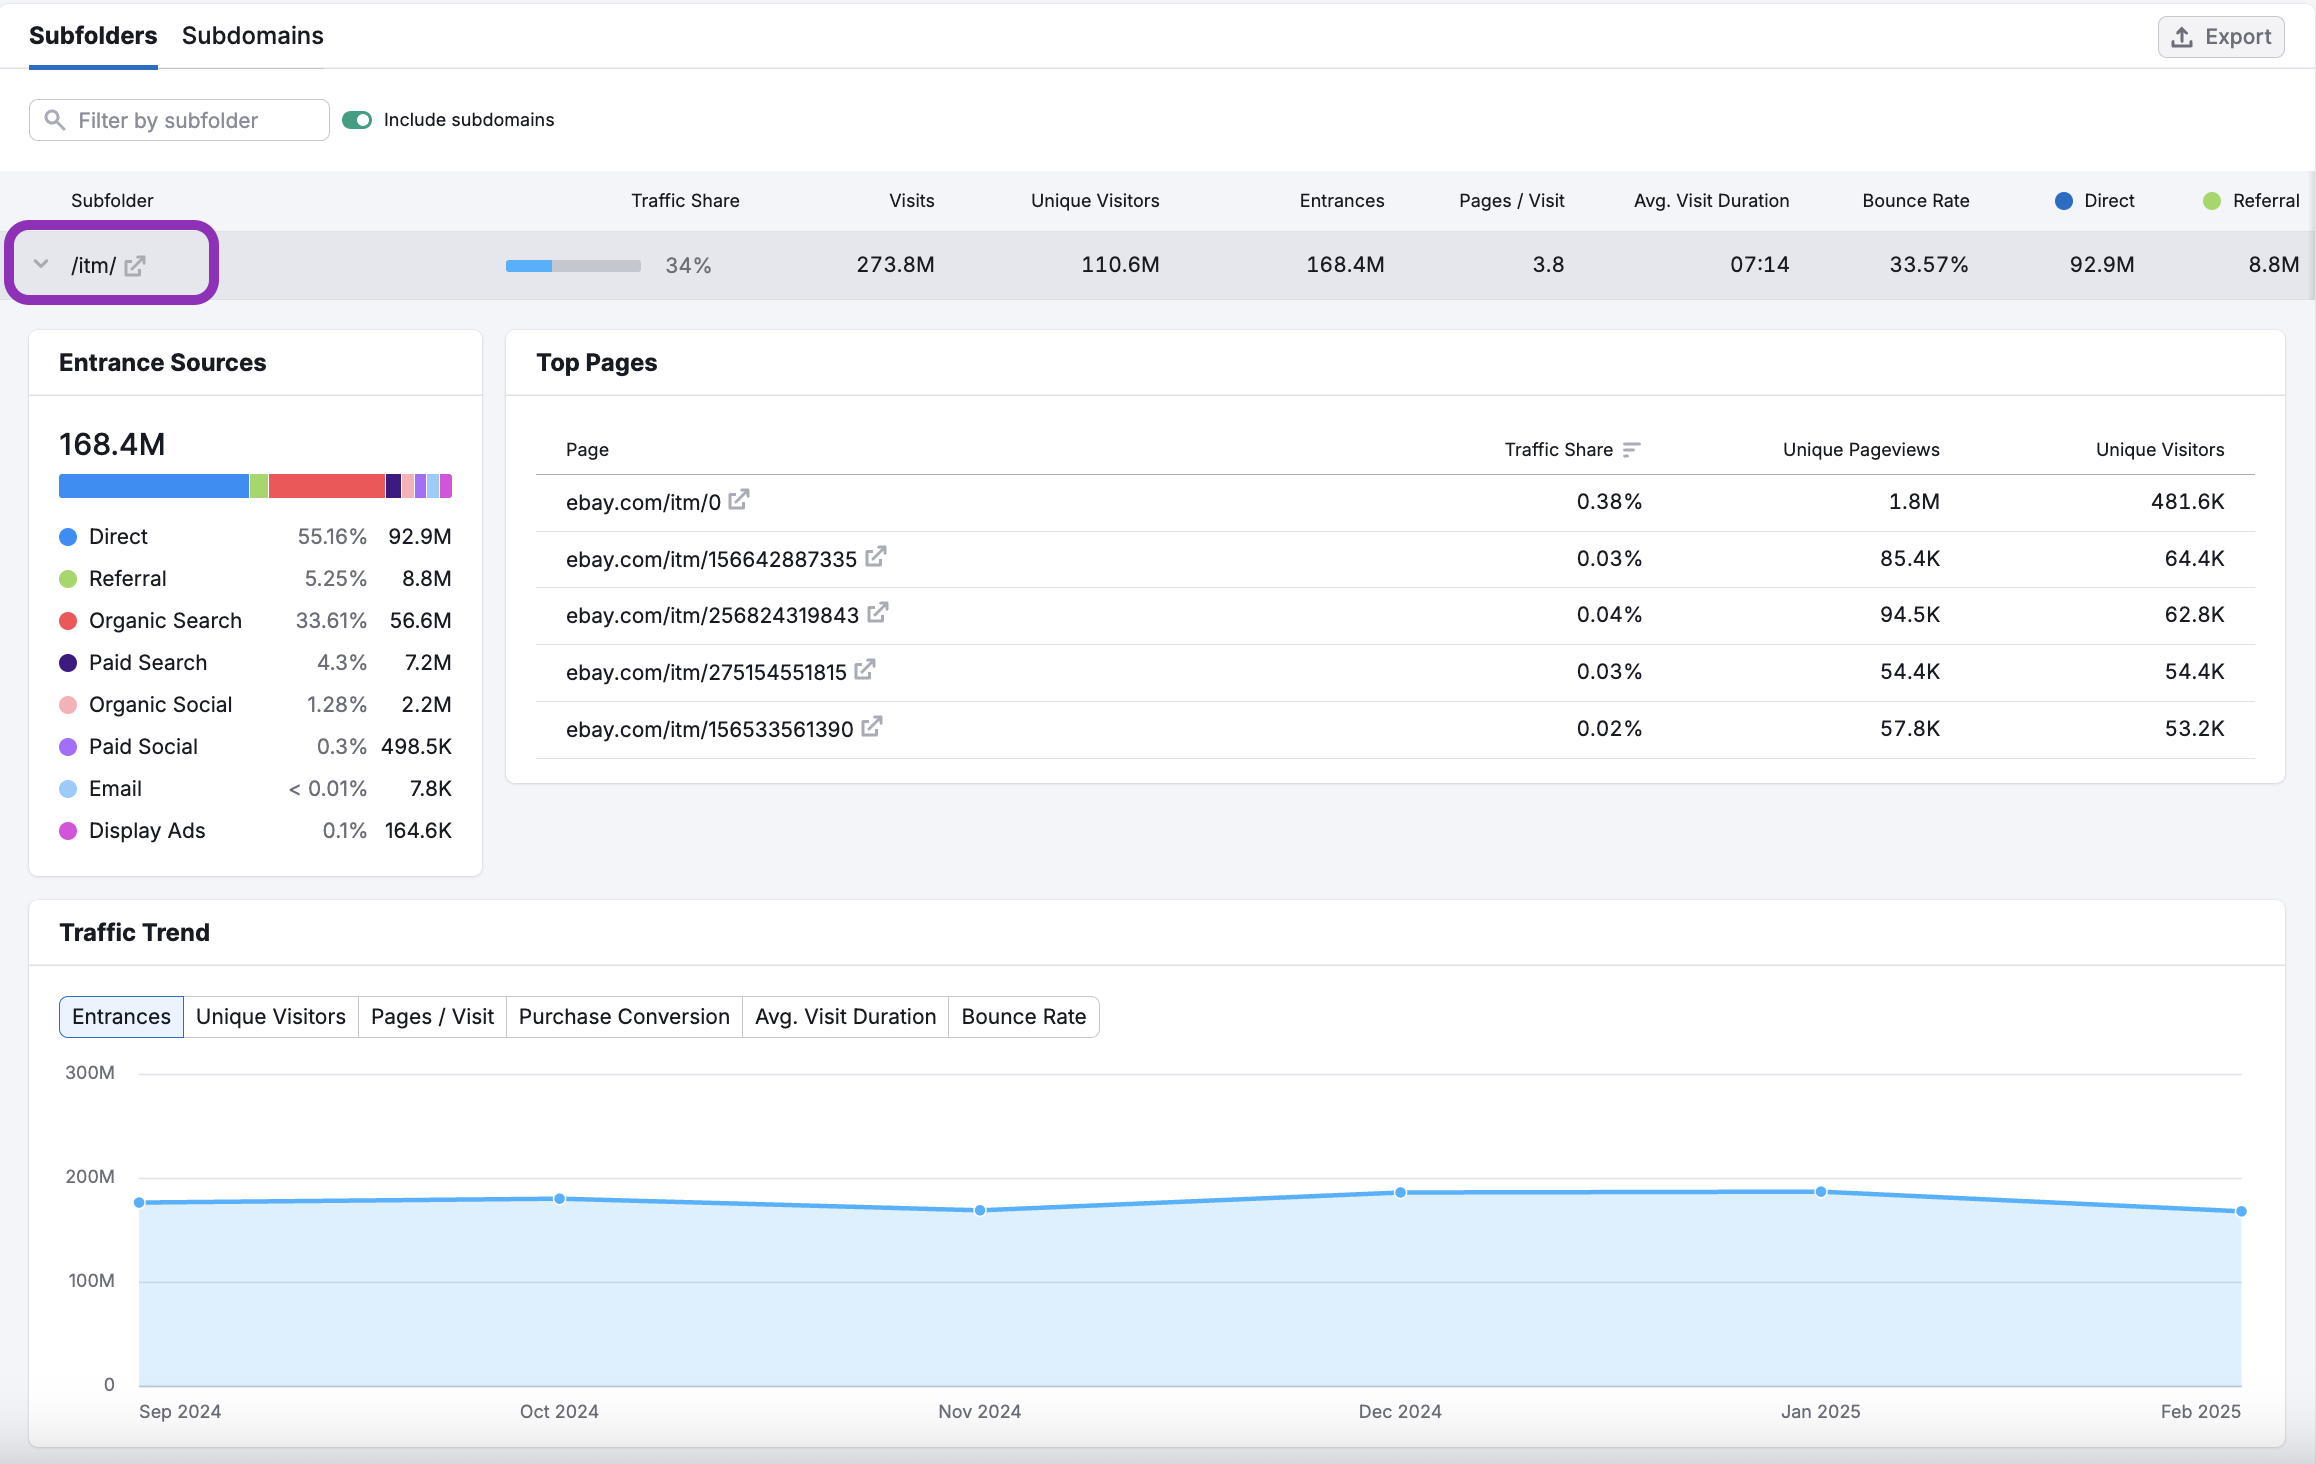
Use these tabs to understand how traffic flows into each section, which pages are performing best, and how engagement is changing over time.
This deeper layer of analysis gives you a clearer picture of how each part of a domain contributes to overall traffic—whether it’s a content hub, product category, campaign page, or support section.
How can I act on the insights found in the Subfolders & Subdomains dashboard?
The Subfolders & Subdomains dashboard gives you strategic insight into how a site is structured—and which parts of that structure are performing best. Here’s how to turn the data into action:
- Benchmark key content sections: See how successful competitors organize content. If their /deals or blog.domain.com section is driving massive traffic, that’s a content signal worth exploring.
- Identify landing page clusters: Pinpoint groups of pages (like a campaign folder) that are bringing in traffic—especially useful for spotting seasonal promos or recent launches.
- Analyze engagement by structure: Use visit duration, bounce rate, and pages per visit to determine how engaging each section is. This can guide your own UX or content design choices.
- Compare formats: Some companies may rely on subdomains for blogs or help centers; others use subfolders. This dashboard shows which approach is working better in terms of traffic and engagement.
By tracking performance across subfolders and subdomains, you can make smarter decisions about content structure, user experience, and traffic growth.
What other Traffic & Market dashboards should I explore?
Pair the Subfolders & Subdomains dashboard with these tools for deeper insights:
- Top Pages – Identify which individual URLs bring in the most traffic
- Sources & Destinations – Track how users enter and leave a site
- Traffic Overview – Get the big picture of overall performance
- Daily Trends – Monitor short-term changes in traffic behavior